
Day Trading Encyclopedia
Breakouts
Breakouts
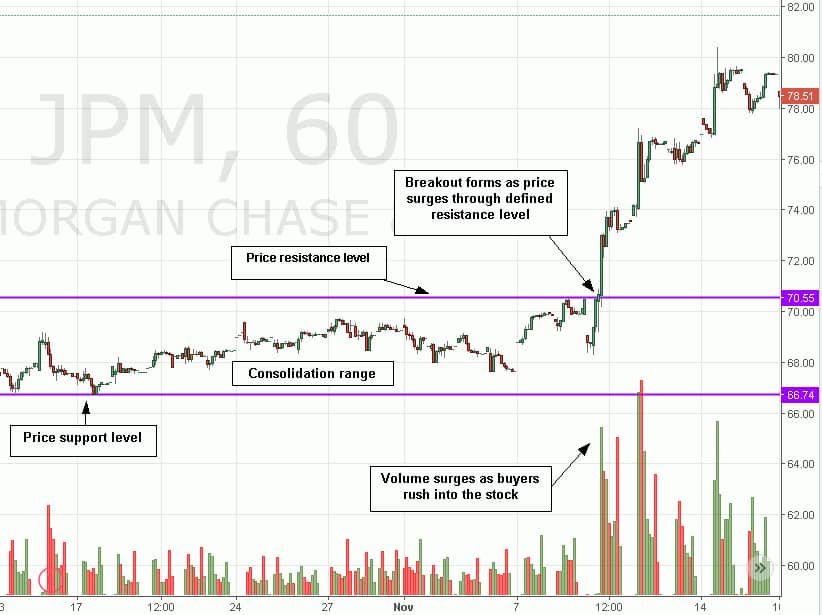
Example of a stock breakout.
What is a Breakout?
A breakout is a bullish technical analysis term depicting a price move that exceeds a defined resistance level and proceeds to sustain higher prices until the next resistance level is formed. Breakouts are usually accompanied with a surge in volume indicating motivated buying demand that surpasses existing supply as prices rise. Breakouts kick start uptrends in the underlying security.
Characteristics
Most uptrends are born from a breakout. An uptrend is a series of higher highs and higher lows sustained by momentum generated from the breakout. Breakouts are bullish price moves that “break” through a resistance level with strong volume stirring panic buying that turns into an uptrend. The breakout panics complacent short-sellers to buy-cover their positions while simultaneously pulling in buyers off the fence. The heavy volume is a strong sign of conviction as the buying frenzy spikes prices to new highs. This generates an uptrend as prices form higher highs while sustaining higher lows. Very importantly, the prior resistance level should become the new support level.
Consolidation
Consolidations are interpreted as an extended period of basing or base building after an immediate trend takes a “rest”. This resting period is identified by the light volume and flat to choppy price range. The longer a stock stays in consolidation, the stronger the breakout tends to be as bears get blindsided.
Why Should Traders Be Interested in Breakouts?
Traders go where the action is. Volatility, momentum and liquidity are the key traits that attract traders to a stock. Often times, there is a fundamental catalyst that actually triggers the breakout including news, events or rumors. This draws more traders to the stock as early as pre-market which may cause the stock to gap. Breakouts can occur throughout the day after the price has rested or reversed.
Anatomy of a Breakout From the Trenches
Here is a simplified illustration of the different participants that join the action when a breakout forms.
A market maker or professional trader may regularly short a stock at the resistance area and buy at the support area almost like clockwork in a defined range. The longer this range holds, you can also assume more and more participants are doing the same thing as transparency becomes too obvious. What happens to the short-sellers when the price initial spikes above the resistance area? They may short-sell more shares assuming it is just a wiggle. Anticipating a price drop, they leverage more shorts building up a larger position than normal. To their horror, instead of pulling back down into the range, the price doesn’t pullback but instead proceeds even higher as volume rises. What happens next? The short-sellers start to cover their positions quickly to stop the bleeding.
Meanwhile, the retail and institutional buyers on the fence that were waiting to buy on a pullback to earlier support levels realize the price shows no signs of falling and quickly step in to buy up shares before the price surges higher. The momentum grows as prices grind higher on rising volume. Momentum traders jump into the shares further perpetuating more short covering. New buyers come in off the fence and algorithm programs leapfrog each other to snatch liquidity. The stock symbol pops up on intra-day stock scanners and tickers around trading desks as it draws more eyeballs to the action. If a popular financial news channel mentions the stock, then even more players enter the fray. Rinse and repeat.
Time Period Breakouts
These breakouts are identified/classified by the specific time period. The most popular are the 52-week breakouts followed by intra-day breakouts.
52-Week High Breakouts
These are consistently the most widely publicized group of breakout stocks most often mentioned by media networks from financial news channels, newspapers, radio shows to local news programs. When stocks make new 52-week highs, it invites more interest from potential investors and short-sellers. However, there is also a belief that transparency is fully recognized once a stock makes the 52-week high list and profit taking is just around the corner.
Intra Day High Breakouts
These stocks show up on television tickers, online newswire services and intra-day stock scanners. Traders are more likely to pay attention to these rather than investors. These stocks are almost assured to have momentum, volume and liquidity and should be carefully followed for trading opportunities.
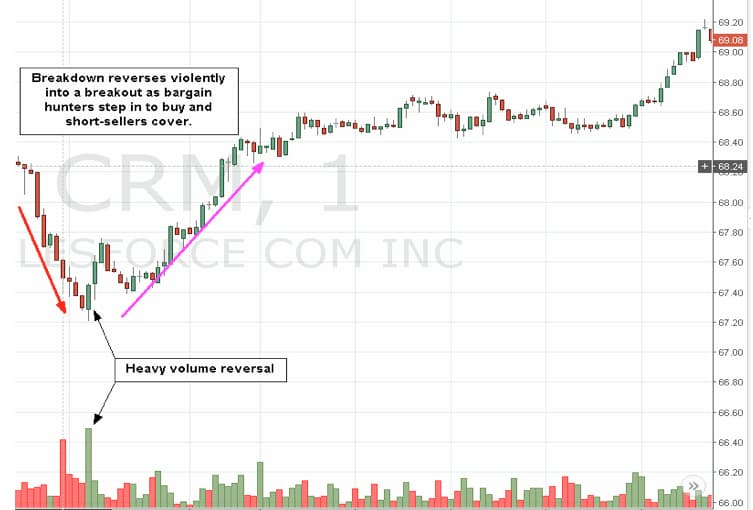
Reversal Breakout Example
Types of Breakouts
The type of breakout can be identified using technical analysis tools like trendlines or moving averages.
Reversal Breakouts
A reversal breakout forms when downtrending prices sharply reverse and spike higher on heavy volume. This occurs from a combination of frantic short covering and bargain shoppers flooding into the stock. The violent nature of the reversal is exemplified from the massive heavy volume. Often times, this can be caused by breaking news or rumors.
The sudden reversal occurs on heavy volume. breakout and reversal of to uptrend.
Consolidation Breakouts
Breakouts can occur after a period of consolidation. Consolidation is characterized as “flat” trading, where prices are contained within an established trading range on relatively light volume. The trading range tends to have a defined support and resistance level that can be identified with various chart indicators including trendlines and moving averages. While consolidations imply a lack of interest, it can be thought of as the calm before the storm with one side (buyers or sellers) playing possum. The light volume represents a lack of interest and complacency, at least that is what one side wants the other side to believe. These breakouts can be form in a very subtle manner on rising volume or violently on sharp volume spikes.
Triangle Breakouts
These breakouts occur when the resistance level is flat but the support level steadily rises. This indicates that motivated buyers are becoming impatient and slowly increasing their bid prices causing the pullbacks to progressively become shallower. Eventually, there are no more pullbacks as buyers swarm in causing prices to breakout through resistance. This pattern is also identified as an ascending triangle breakout.
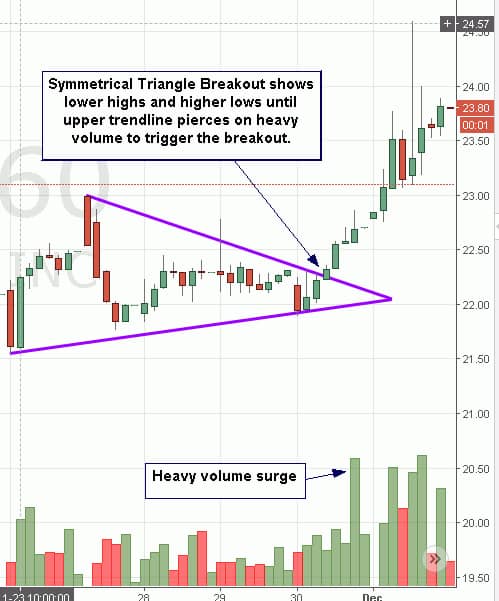
Symmetrical Triangle Breakout Example
Breakout Structure
There are three parts to a successful breakout. The keyword is successful. When a stock fails a breakout attempt, it results in a wiggle or a headfake. This results in a pullback again towards the support level where it may bounce again. Charting tools and indicators can be used to visually track and monitor breakouts.
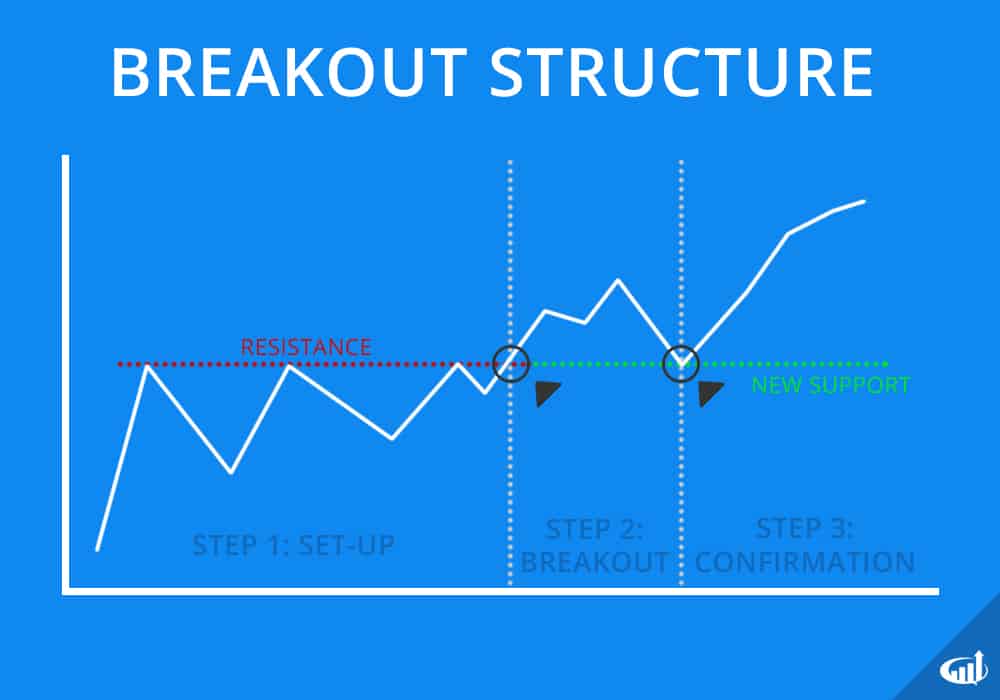
A breakout consists of a set-up, breakout, and confirmation. Upon confirmation, previous resistance should act as new support.
Set-Up
For a breakout to develop, there should be a well defined price resistance level or else there is nothing to “breakout” through. Stocks that don’t have resistance levels are usually still in an uptrend. The resistance can be identified with a trendline or a moving average.
Breakout
The actual breakout occurs when price rises or spikes through the resistance level on heavy volume, usually double or more volume. This can be viewed on the volume bars. Traders prefer adding a moving average line to the volume bars to track this.
Confirmation
The difference between a breakout and a wiggle or headfake is that the breakout sustains its price above the prior resistance level. Usually a breakout will re-test the resistance on a pullback for confirmation. If the price manages to stabilize above the prior resistance, then it becomes a new support level. A successful re-test of the new support instills confidence inviting more buyers into the stock to sustain the uptrend.
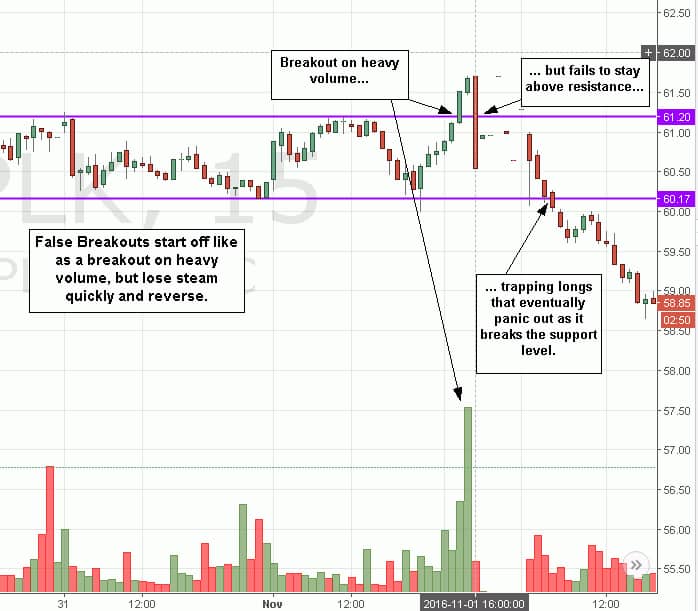
False Breakout Example
False Breakout Reversals
When headfakes occur on heavy volume, it may lead to a false breakout, which has more dire consequences. The heavy volume indicates an expensive push from confident buyers assuming the breakout is a foregone conclusion, but the greed quickly turns to fear as the initial price surge is met with even heavier sellers, causing the buyers to retreat.
False breakouts can result in a sharp trend reversal as too many longs stepped “all-in” with conviction only to get trapped. Like a boat that capsizes with too many passengers, the stock not only slips back under the prior resistance level but also collapses further through the support levels generating more panic selling.