
Dow Jones Industrial Average (DJIA)
Charles Dow, a founder of the Wall Street Journal newspaper, created the Dow Jones Average (DJA) in 1886. This index was composed of 12 industrial companies. In 1896, the industrials split away from the transports and was renamed the Dow Jones Industrial Average (DJIA). The transportation companies including the railroads were placed in the Dow Jones Transportation Index (DJTI). The widely popular DJIA benchmark index has changed over 50 times since inception swapping out 120 companies. General Electric (NYSE: GE) is the only remaining original industrial component. However, it was initially swapped out of the index in 1889 and 1901 before being added permanently in 1907.
The Dow Jones Industrial Average is commonly referred to as ‘the markets’ when news about the general U.S. equities markets are reported on the evening news. It is a price-weighted index composed of the 30 large-cap publicly traded companies that represent the leaders of the U.S. economy, as decided by the editors of the Wall Street Journal. The label of ‘Industrial’ no longer applies as the index has diversified to include technology, healthcare, energy, utilities and financials. While the general public may consider the DJIA as the main market benchmark, traders tend to prefer a more widely diversified benchmark known as the Standard and Poor’s 500 (S&P 500).
The Dow Theory
Charles Dow wrote over 250 editorials in the Wall Street Journal depicting his analysis and theories on market behavior. After his death in 1902, Hamilton, Rhea and Schaefer organized his thoughts into a thesis aptly titled the Dow Theory, which is composed of six basic precepts: market trends form in three phases (accumulation, price movement and distribution), the stock market will price in the news, markets have three general movements (major trend, reversions and short-term movements), the DJIA and DJTA must have confluence to confirm bull and bear markets, volume confirms trends and trends continue through noise until they confirm a reversal.
Standard and Poor’s 500 (S&P 500)
The Standard and Poor’s 500 is a market-capitalization weighted benchmark index composed of 506 large-cap companies that broadly represent the performance of the U.S. economy. The S&P 500 futures are tied to the index and are the most widely traded futures contracts in the world including the big contracts and the popular S&P 500 E-minis futures contracts which are accessible up to 23 hours a day from Sunday evening at 6pm EST. to Friday 4:15pm EST.
The S&P 500 is the most widely traded futures contracts in the world. The Chicago Mercantile Exchange is credited for this phenomenon with the introduction of the S&P 500 e-minis product in 1997. The e-minis contract split the regular size contract by 1/5th which generated much more liquidity, more participants and more volume due to the around the clock access. S&P 500 e-minis trade on the Globex Exchange providing upwards of 23-hour trading access from Sunday evening 6 pm EST. through Friday close at 4:15pm EST. The e-minis generate over $100 billion in trading volume daily. This instrument is used for direction trading, portfolio hedging, arbitrage, program trading, market direction and multitudes of other uses and strategies. Intra-day traders common use the S&P 500 as the true gauge of market direction and trading climate. When the S&P 500 futures rally, the equities markets follow and vice versa when they plunge. Traders use it as a gauge if their stocks are converging or diverging with the markets. The S&P 500 is such an embedded force in the markets that it affects up to 75% (.75 beta) of a stock’s price movement on any given day, absent individual news.
Exchange Traded Funds (ETF)
Exchange trader funds (ETF) have seen a surge in growth as the number of ETFs almost outnumber the individual issues on the listed exchanges. ETFs track the performance of a portfolio of stocks (and or other instruments) in a particular index, industry, sector, asset classes, strategies or themes. ETFs allow investors and traders to actively participate in any given theme. Traders must be careful to pay attention to liquidity as it can be thin on the more exotic ETFs. For example, the Direxion iBillionaire ETF (NYSEARCA: IBLN) tracks stocks owned by billionaires and averages 2,532 shares volume a day. Traders should stick to the most widely traded ETFs. The following are some of the best ETFs for trading and hedging.
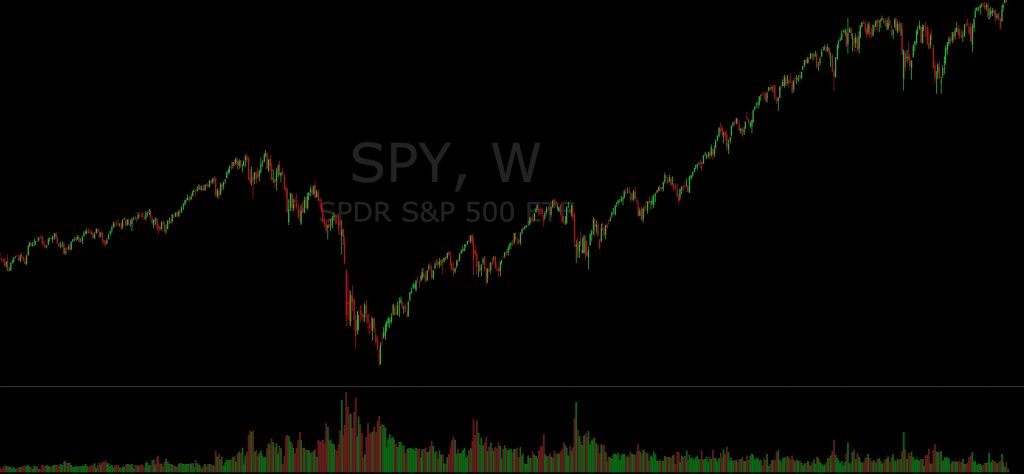
$SPY ETF Weekly Chart
SPDR S&P 500 ETF (NYSEARCA: SPY)
This is the most liquid and heavily traded ETF as it tracks the movement of the S&P 500 index. Traders can trade this as they would any other stock or use it as a leading indicator when monitoring other stocks. SPY can be used as a measuring stick to gauge buy or sell fades with sectors to individual stocks to determine potential trade set-ups. Investors can delta hedge a portfolio or options position easily with the SPY during volatile markets. Other benchmark index ETFs to consider are the PowerShares QQQ Trust (NASDAQ: QQQ) and SPDR Down Jones Industrial Average ETF (NYSEARCA: DIA).
IPath S&P 500 VIX Futures (NYSEARCA: VXX)
This is the premiere trading vehicle for volatility index (VIX) traders. While traders associate volatility with falling markets, it’s not always the case. Traditionally when the VXX drops to low double-digits, a market sell-off is near the horizon. New traders should acclimate themselves to the movements and behavior of the VXX through up and down markets to get a better perspective on how it moves. Other VIX-based ETFs to consider are the Proshares Ultra Vix Short-Term Futures (NYSEARCA: UVXY) and ProShares Short Vix Short-Term Futures (NYSEARCA: SVXY).
Direxion Daily Gold Miners Bull 3X ETF (NYSEARCA: NUGT)
This is a leveraged ETF that tries to duplicate triple the performance of the NYSE Gold Miners Index on a one-day basis. Volumes tend to increase when gold prices see resurgence in volume and volatility, especially during global macro market events and periods of systemic risk. Traders and investors must be aware of the dangers of leveraged ETFs. Aside from the volatility aspect of duplicating a 3x daily performance, the leveraged ETFs are only designed to mirror performance on a one-day basis. This means the ETF is re-balanced daily. If there are any large gaps up or down the next morning, it adds to the erosion/slippage factor. For this reason, it is recommended only to trade the leveraged ETFs and forgo longer-term investments.
Decay Effects on Leveraged Inverse ETFs
Bearish ETFs suffer the worst erosion due to compounding and contango effects. UVXY is a good example of this as it averages 8-25% monthly value decay. Annually, the UVXY averages a 70-90% value decay. Long-term investors found out the hard way that bearish leveraged ETFs should never be held long-term during the early 2000s, which resulted in multitudes of class action lawsuits.
The UVXY is a double leveraged Vix ETF performed its sixth reversal split since inception in 2011. In fact, if you purchased the UVXY at $40 a share at inception, it would be worth $0.08 per share on July 2nd, 2016! Historically, the UVXY undergoes a reverse split in price every six to 15 months, as the decay grind down the price to the $10-$5 range, where the issuer decides to perform another reverse split.
