
Day Trading Encyclopedia
Technical Indicators Fibonacci Retracements
Fibonacci Retracements
What are Fibonacci numbers?
Fibonacci series are numbers starting with 1 and adding the prior number to get the forward number. Therefore, 1 + 1 = 2, 2 + 1= 3, 3+2 = 5, 5+3 = 8, 8+5 = 13, 13+8 = 21 and so forth. These generate the Fib number series 1,2,3,5,8,13, 21. The series goes on infinitely but for example’s sake we’ll stop at 21. When the prior number to any Fib is divided into the forward number and vice versa, the result is a variation of .618. This is called the golden ratio, which can be found in nature, the curvature of a snail shell to the formation of galaxies. The .382 is derived from dividing a number by two spaces forward or preceded in the sequence.
Fibonacci Retracement Levels
The .618 and .382 are the two most important Fibonacci (fibs) ratios in the markets. This is likely due to theory that human emotions can be tracked with fibs as well. The .618 and .382 are inflection points where fear and greed result in price action. These are the retracement levels most likely to generate a reversal price move. Therefore a pullback to the .618 price level usually results in a bounce on an up trend. A bounce to the .618 price level usually results in a peak and sell-off in a downtrend. For traders the key fib retracement levels are as follows: .382, .50, .618, .786 and .886. Fib extension levels are 1.27, 1.414 and 1.618. A whole number can be added as the pre-fix moving forward. Most direct access-trading platforms have Fibonacci retracement drawing tools. Check with your broker for this useful tool.
Drawing Fibonacci Price Lines
To understand the impact of fib levels, it’s best to practice drawing fib lines. These can be uncanny in their accuracy for turning points. Seeing believing. When a stock makes a high and a low, connecting the two points up and back down produces a set a of fib retracement levels in both directions. There is much conjecture as to where the high and low plot points should start. This depends on how far back you decide to use for high and low points. The rule of thumb is that longer time period fibs tend to have stronger support and resistance levels but are also much wider price ranges, very similar to any moving averages used on a weekly versus a 15-minute.
Fibonacci Retracement Levels
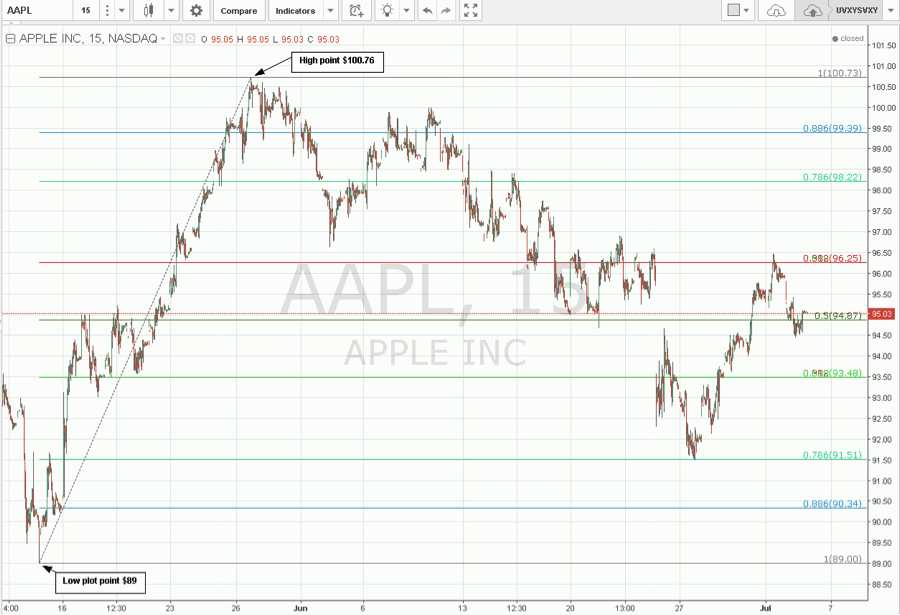
Intra-day traders can start with a 15-minute time period chart and plot the high and low points going back up to three months. The key is to have a very distinct high and low. In the illustration of Apple, Inc. (NASDAQ: AAPL), the fib low point was 89 on 5/13/2016 and the high point was 100.73 on 5/26/2016. Note the current date on the chart is 7/5/2016. Once a high and low range is established, then the retracement levels can be determined. In this example, we plot the high to low fib retracement from 100.73 to 89 and then plot back up from low to high 89 to 100.73. This generates fib retracements in both directions. The .382 and .618 overlap forming an overlapped fib, which is a very significant level. Once the fib lines are set, then the playing field is mapped out. The uncanny accuracy of fib lines have to be seen to be believed.
How to Use Fibonacci Retracements
Keep in mind fibs are simply one tool and should be used in combination with other indicators and or a trading methodology. Fibs give a trader a heads up on significant price inflection points that the trader can watch for a potential trade. Usually a 20 cent overshoot can be used. On the example with the 15-minute AAPL fib chart, you can see how the circled pink fib levels played a key role in either a reversion bounce or a breakout point. Keep in mind that fibs are static, so they do not change, like moving averages. The only time to re-draw fib lines would be when the high or low of the plot points is surpassed.
Fibonacci Retracements applied to an AAPL chart.
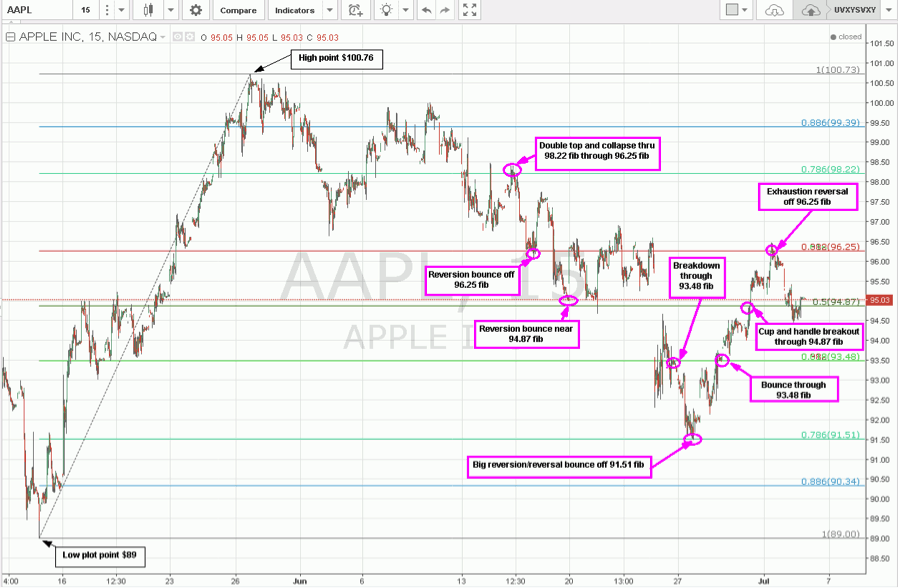
Taking a look again at the AAPL fib chart, notice the double top on AAPL forms a rejection at the 98.22 fib thereby causing a collapse to the 96.25 key overlapping .618/.382 fib support, where it bounces all the way back up towards 97.70 before peaking and selling off again. This time the 96.25 fib support cracks as AAPL sells down towards the 94.87 fib before bouncing again back up through the 96.25 fib and chopping until a gap down. The 93.48 fib maintains resistance triggering a sell-off down to the 91.51 fib at the .786 level before setting up a reversal rally back up through the 93.48 and then a cup and handle breakout at the 94.87 fib that squeezes AAPL up to the overlapping .618/.382 fib resistance at 96.25, where it peaks and sells off again back through the 94.87 fib.
Optimizing Fibonacci Retracement Trading
To be more effective with fibs, it’s recommended to consider using a price tracking indicator like moving averages in conjunction with a momentum indicator like MACD, RSI or stochastics can help time more precise trades at the fib levels. Practice makes perfect. Traders should continue to draw fib levels on their core stocks and just observe how well they provide reversals to gain first hand experience and most importantly to build trust in them. While no indicator or tool is 100% accurate, the fib retracement lines can be very effective when they are applicable. This is why they should only be another tool in a trader’s arsenal and not the sole tool. The more convergence between a trader’s tools, the higher the probability for a profitable trade.
When planning a swing trade, it helps to expand the chart time frames to include daily and weekly charts. Remember that just because a chart is on a 15-minute time frame, it will still encompass months of a price range. It’s important not to draw too many fib lines on too many time frames so as to saturate the charts with too much data. A good medium is to include one set of weekly fibs, then no more than two sets of 60-minute or 15-minute fibs. This provides wider time frame and intra-day time frame fibs that can be drawn once and used for at least three or more months until the range breaks. Larger time frames like the weekly will be much tougher to break the range and it is possible to have fib lines that don’t require re-drawing for up to a year. Earnings season is usually when the most material news is released which can result in new highs or lows. Fibs are natural turning points based on human emotions. Although algorithm programs run the markets, humans are still programming them and being gamed by them.