
Day Trading Encyclopedia
Introduction to Stock Charts
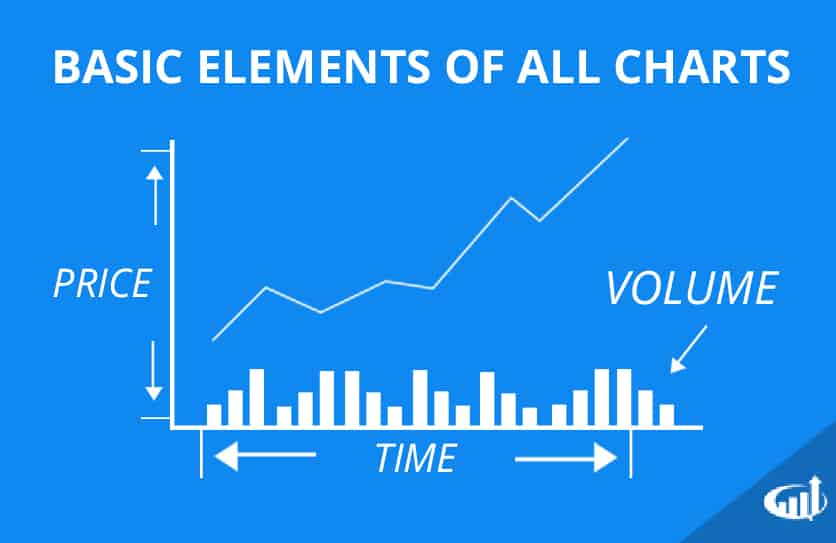
There are a variety of different chart types, however, they all share the same basic elements.
What Are Stock Charts?
Charts are the primary tools for technical analysis. Charts conveniently visualize the price action by plotting the historical market data of the underlying financial instrument on a graph. This visual representation allows for easier identification of common and rare price patterns. Technical analysis tries to answer questions pertaining to the price action. What is the support and resistance? What is the trend? Where is the stock going? What is the sentiment on this stock? The answers to these questions are ultimately played out in time. Charts help traders to map out the price history and forward trajectory to make better-informed trades.
Why Traders Need Charts
Charts are like a map. History tends to repeat itself. This has proven itself time after time in financial markets. Price action fits into repeating patterns. Charts are the best way to illustrate this natural recurrence. Interpretation of charts can be subjective to the individual methodology. The beauty of the charts is that with time, the correction interpretation will prove itself as transparency materializes. However, by then, it may be too late to capture a profit opportunity. The name of the game is to capitalize on transparency before it fully materializes.
Predictive and Foreshadowing Elements
While all stock traders will use charts in their own way, the ultimate goal is still the same. Stock charts allow traders to view in order to make educated predictions about a stock’s future price action. For most day traders, stock charts are the primary source of data used in their strategy. Day traders will look for chart patterns, analyze volume, and pinpoint significant price areas. By doing so, a trader can increase their chances of profitability before entering a trade.
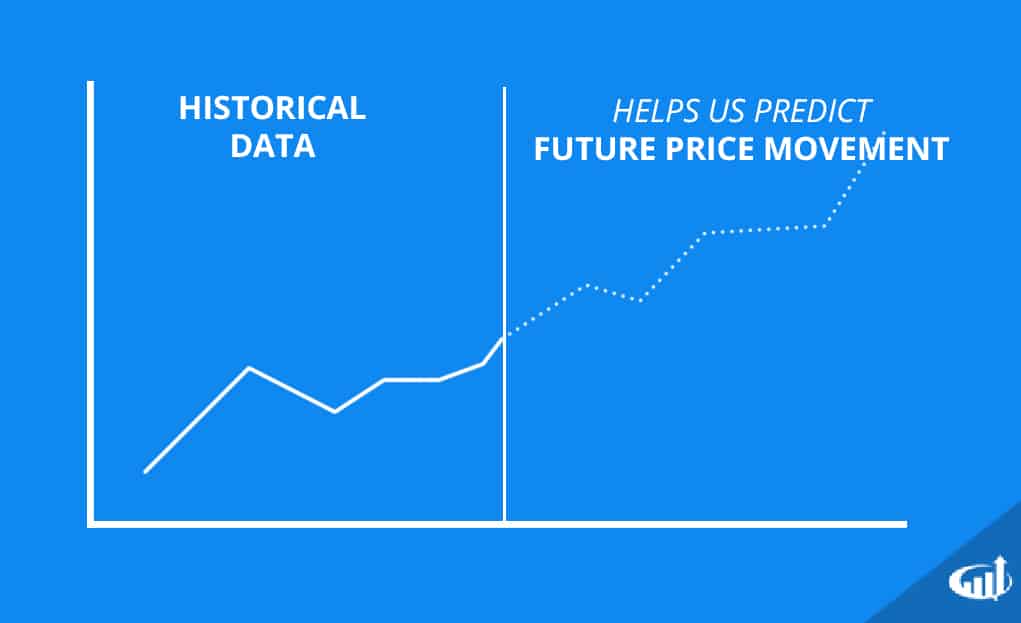
Traders analyze historical trends to make predictions about future price movement.
Stock Charts Video Course
Stock charts are a visual form of data, and learning how to use them requires visual aid. Check out the video below for a detailed walk through of how stock charts work and some of the best ways to use them. This video will cover basics of candlestick charting, which is one of the most common chart types used by day traders.