
Day Trading Encyclopedia
Chart Patterns Support and Resistance
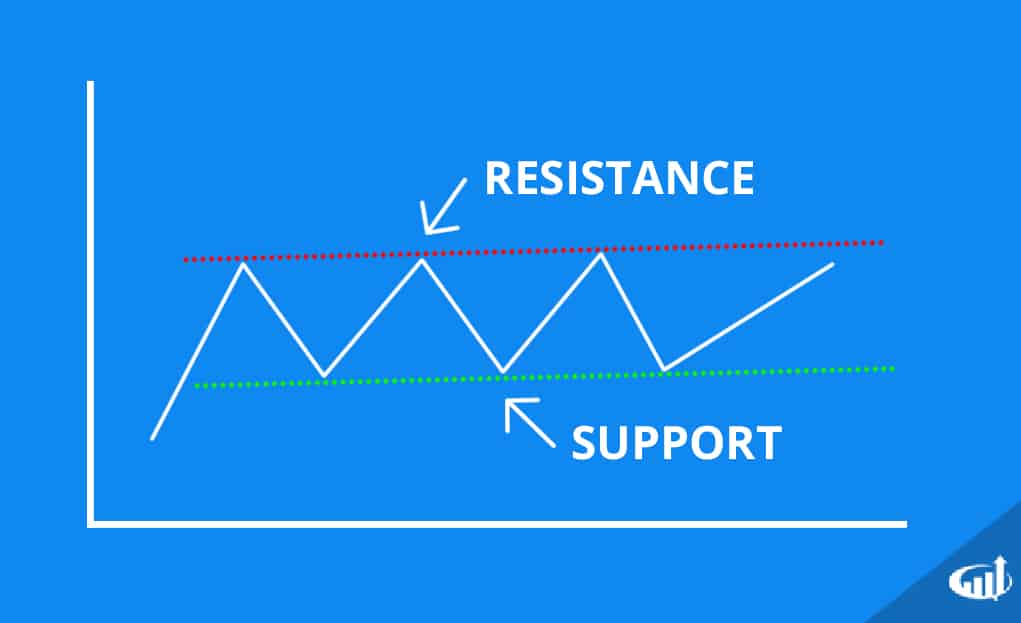
Support and resistance levels help traders identify price points of interest.
Support and Resistance Levels
Charts visualize support and resistance levels. These are price levels that consistently reject attempts to exceed above (resistance) or below (support). Supports are a price level that the stock will not fall below. Resistance is a price level that the stock can’t seem to rise above. The longer these levels hold, the more they become stabilized for an eventual breakout or breakdown. Breakouts forms when the resistance is finally surpassed as buyers come in off the fence and short sellers get buy to cover their shares. A breakdown form when the support level finally cracks as sellers panic to unload their positions and short sellers try to add to their positions in often on a spike in volume.
Divergence patterns using indicators compared to prices use trend lines at the indicator peaks and bottoms to visualize an indicator support or resistance. When then particular level is broken, it triggers a reaction in the price charts. These are temporary support and resistance since indicators often fluctuate, as time is a dynamic component. The MACD is often used for divergence signals using the oscillator peaks and valleys compared to the price action.