
Day Trading Encyclopedia
Technical Indicators Moving Averages
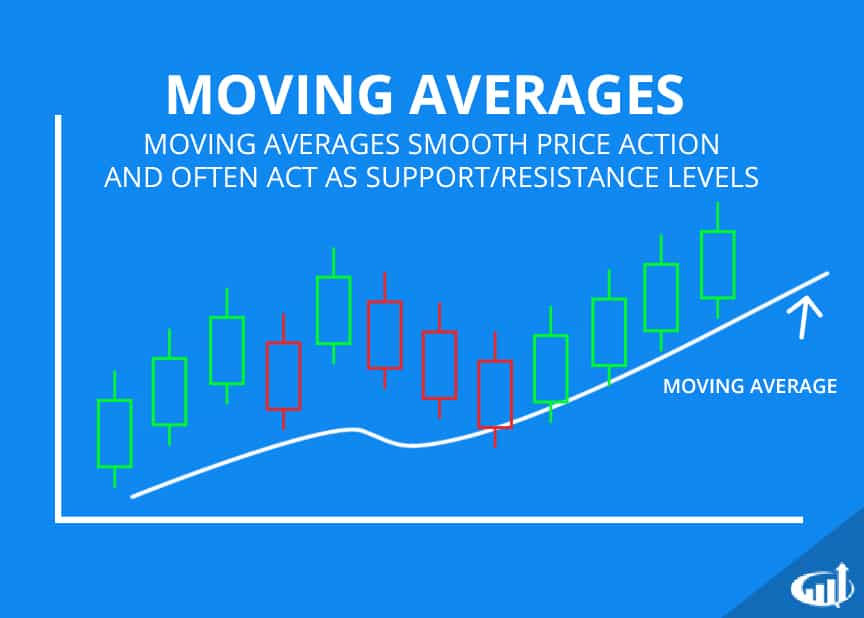
Moving Averages (MA)
A moving average is the average price for a set time period of trade transactions. As each time period ends, the average price of the prior closing trades are calculated to derive the overall average price for the specified number of periods, which is then plotted on a price chart. For example, a 1-minute 5-period moving average would derive an average based on the five prior closing prices in 1-minute increments. Therefore, it would take 5 minutes for the first moving average plot. Each new 1-minute period close thereafter will average the five prior periods to plot the new average continuously throughout the trading session. Since new values are updated every period close, the average price will update, which is why it is called a moving average. The moving average indicator is drawn as a continuous line that connects each updated moving average value smoothly on a price chart. As price moves higher, the moving average line will also slope upwards and vice versa to slope downwards when price is falling. The close refers to the closing price of the specified time period interval. The simple moving average (SMA) formula is:
SMA = (Total Sum of Closing Prices)/Total Number of Closes
An exponential moving average places more weight on the most recent prices by adding a weighting multiplier. The exponential moving average (EMA) formula is:
EMA = (Current Price x (2 / 1 + Total Number of Periods) + (Previous EMA x (1 – (2/1 + Total Number of Periods))
Exponential moving averages are more sensitive to price fluctuation and reduces the lag which results in earlier signals than a simple moving average. However, earlier is also prone to more headfakes and chop whereas simple moving averages have a superior smoothing factor.
Moving Averages
Using Moving Averages:
Traders generally utilize a combination of two or more moving averages lines, which include a smaller period followed by a larger period, like a 5-period and a 15-period moving average. The smaller period lead moving average reacts quicker with more sensitivity versus the larger lagging moving average period, which is more smoothed out and slower. The 5-period is the lead moving average support and the 15-period is the laggard moving average support. An uptrend forms when both the 5-period and 15-period moving average lines are rising. A downtrend forms when both moving average lines and falling. The price distance between the two moving averages is considered the trading channel.
One of the most popular combination of moving averages is the 50-period moving average combined with the 200-period moving average. A ‘death cross’ signal forms on a benchmark index like the S&P 500 when the daily 50-period moving average crosses down through the daily 200-period moving average. This can form a large magnitude sell-off for the general markets.
Generally, larger periods form stronger moving average support and resistance levels, due to the larger sample size of historical data. Moving average crossovers can signal a reversal in trend, when the shorter period crosses through the longer period moving average line (i.e. 5-period moving average crosses down through the 15-period moving average). A moving average crossover up is often used as a buy signal, while a moving average crossover down is used as a sell/ sell short signal. Moving averages can be combined with various momentum indicators to form a complete perspective of price action.
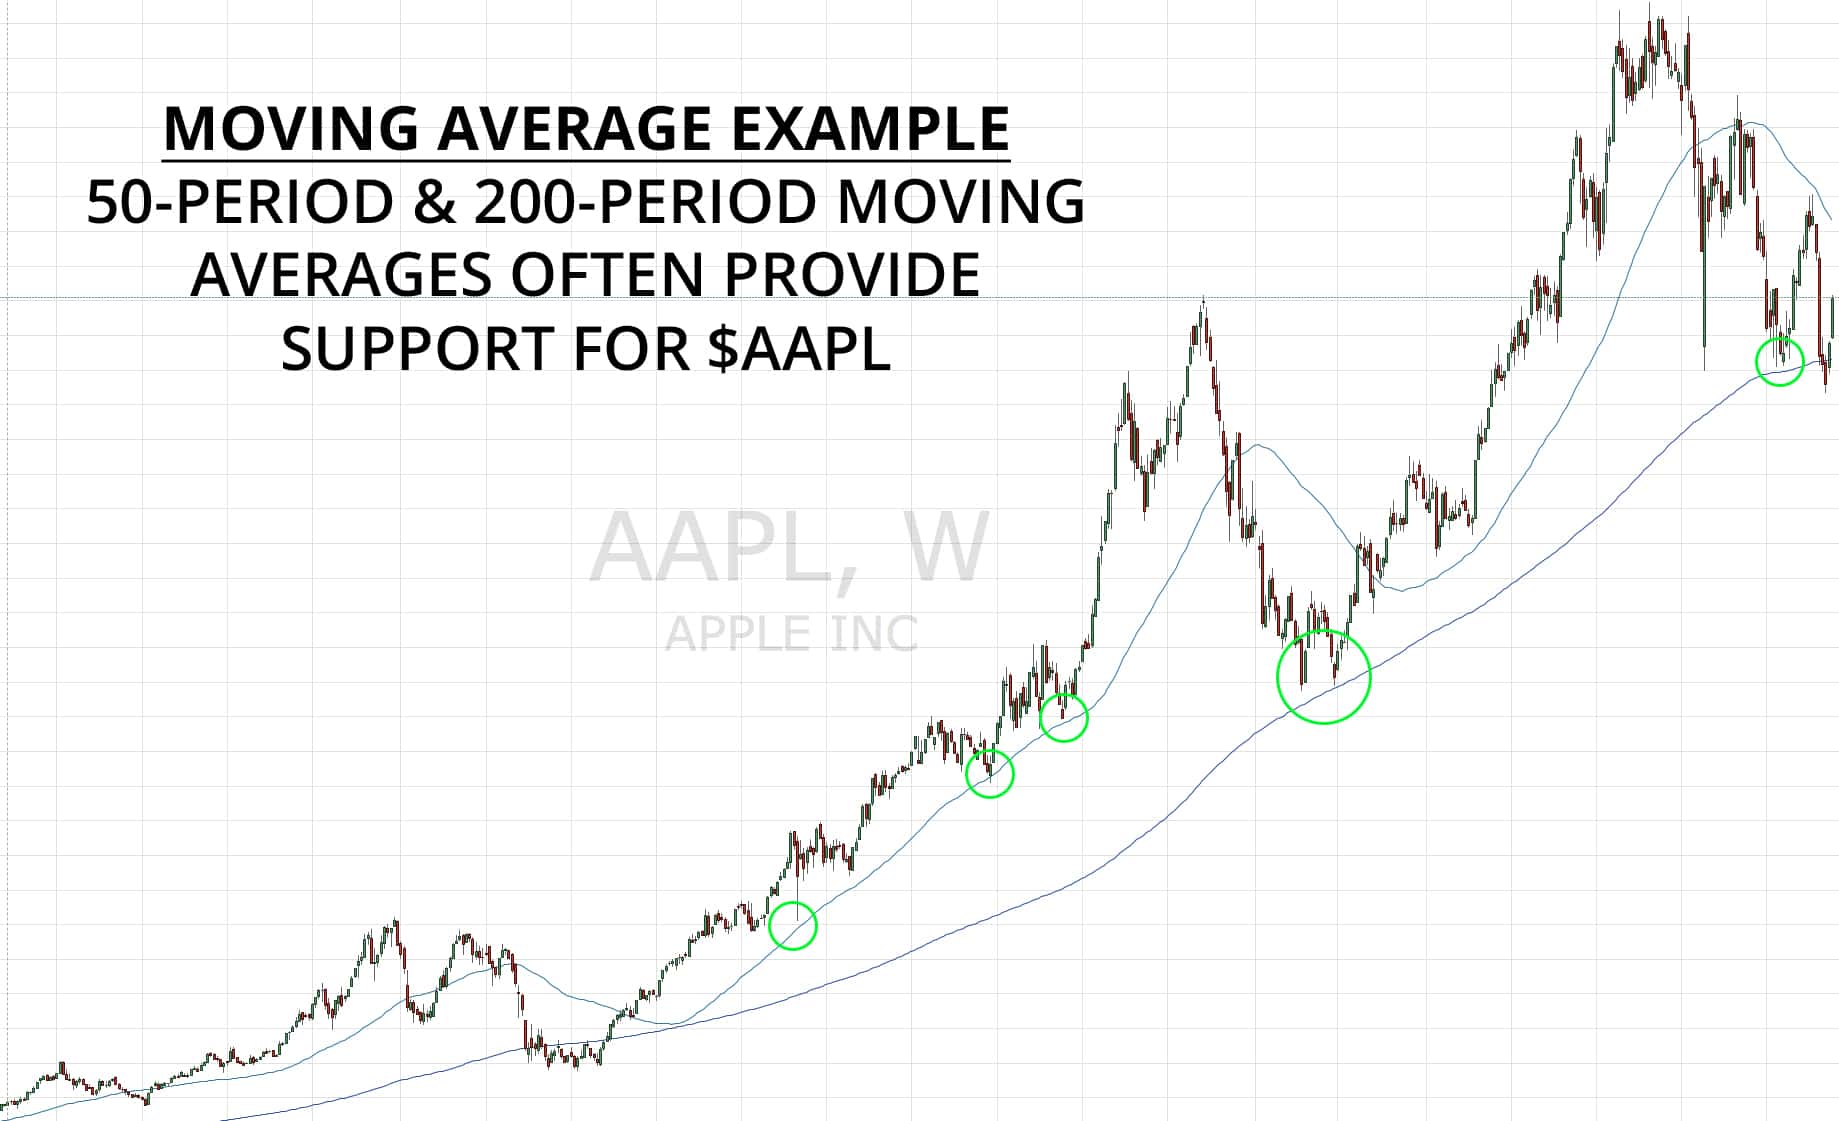
Moving Averages Example