
Day Trading Encyclopedia
Stock Charts How to Read a Stock Chart
How To Read a Chart
The basic chart interpretation covers three aspects: the trend, the support and the resistance. The trend can be determined by observing the sequential highs and lows. A stock (or whichever financial instrument) making higher highs and higher lows indicates a rising price trend known as an up trend, a net price rise. Inversely, if the stock is showing lower highs and lower lows, it is indicating a price down trend, a net price fall.
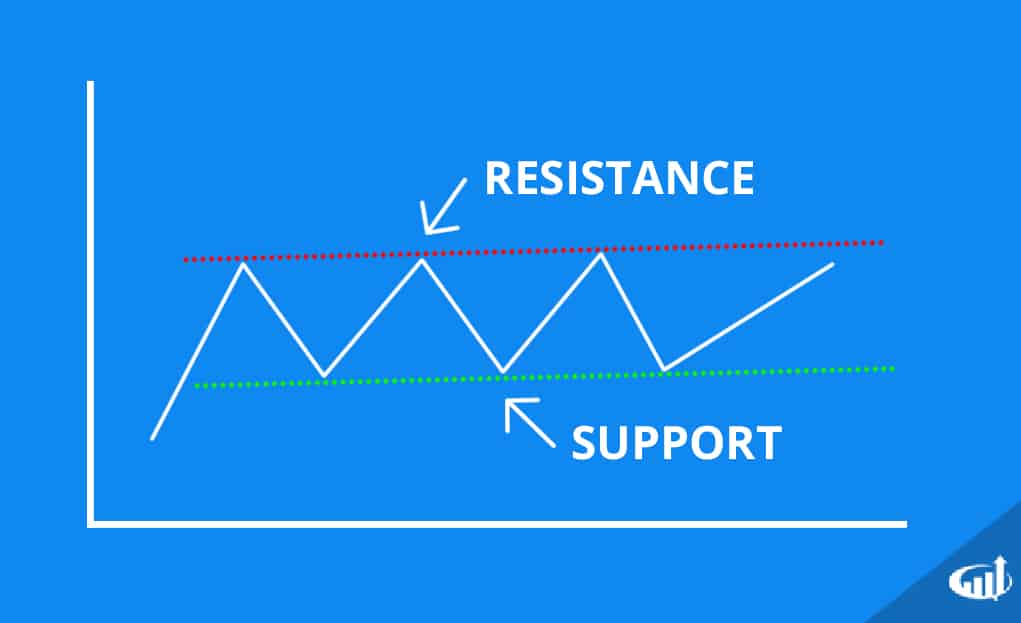
Support and resistance levels help traders identify price points of interest.
Price Support Levels
If the stock tends to continually bounce at a specific price range, then it may be a price support level. Support levels are composed of buyers who are motivated to accumulate shares. Support levels that continue to rise higher are components of up trends. This indicates the buyers are getting impatient and raising their bid prices to attract more liquidity. If the stock is not making higher highs, then a pivotal reaction will eventually form where the resistance level will either breakout and spiking the price higher, also known as an ascending triangle pattern, or the resistance will be too strong as the support breaks down.
Price Resistance Levels
If a stock continually falls at a specific price range, then it may be a resistance. Resistance levels are composed of sellers seeking to unwind long positions or add to short positions. A falling resistance level is a component of down trends, which indicates that sellers are getting impatient and continuing to lower their selling prices.