
Day Trading Encyclopedia
Technical Indicators Bollinger Bands
Bollinger Bands
What are Bollinger Bands?
John Bollinger developed Bollinger bands in the 1980s. This tool serves two purposes, to measure the nominal trading price range of a stock and to signal when a price expansion or contraction period/phase is forming. Bollinger bands are available on most trading platforms and usually require only two inputs. The default setting has the moving average set at 20 periods and the standard deviation set at 2. The offset setting is usually kept at zero. This generates three moving averages composed of an upper moving average also known as the upper envelope, a middle 20-period moving average and a lower moving average also known as the lower envelope.
Contraction and Expansion Phases
The middle Bollinger band (BB) is considered a trend line. A rising middle BB combined with upper and lower BBs is considered an up trend as long as the stock remains above the mid BB. A falling middle BB combined with falling upper and lower BBs is viewed as a downtrend as long as the stock remains under the mid BB. When the upper and lower BBs move towards each other, it is forming a contraction, often followed by a flat or slightly sloping middle BB. This indicates price range compression and consolidation. These periods are choppy and dangerous. Dangerous because of the next phase that forms after the compression, which is the expansion. Traders that are caught on the wrong side of the expansion can suffer dramatic losses quickly. The expansion phase follows compression phase where the BBs start to expand again indicating a breakout or breakdown followed by a trending price move. Contractions occur ahead of a price expansion and breakout/breakdown.
How to Use Bollinger Bands
Bollinger bands can be interpreted and used in many different ways by themselves or as a component of a trading system. The upper BBs can be used a price target levels on longs, or areas to short-sell for a reversion back to the mid BB trend line. The lower BBs can be used as a price target area for short-sells to cover as well as longs for a reversion back to the mid BBs. Traders can also use the mid BB as a breakout or breakdown trade towards either of the upper and lower BB targets. The most important thing to remember is to limit trading activity during the compression phase. Usually this period is full of chop and headfakes that can frustrate traders to a point of over leveraging a position on the wrong side when the expansion phase forms. All breakouts and breakdowns look identical to wiggles, except the pullbacks are shallower as they make higher highs and higher lows on breakouts and lower highs and lower lows on breakdowns. When you are in the eye of the storm getting chopped around in a consolidation, it’s easy to overlook the initial signs of a range expansion until it’s too late. These periods have light volume for a reason. The participants are waiting for the expansion to step in. It is prudent to stay out of compression periods.
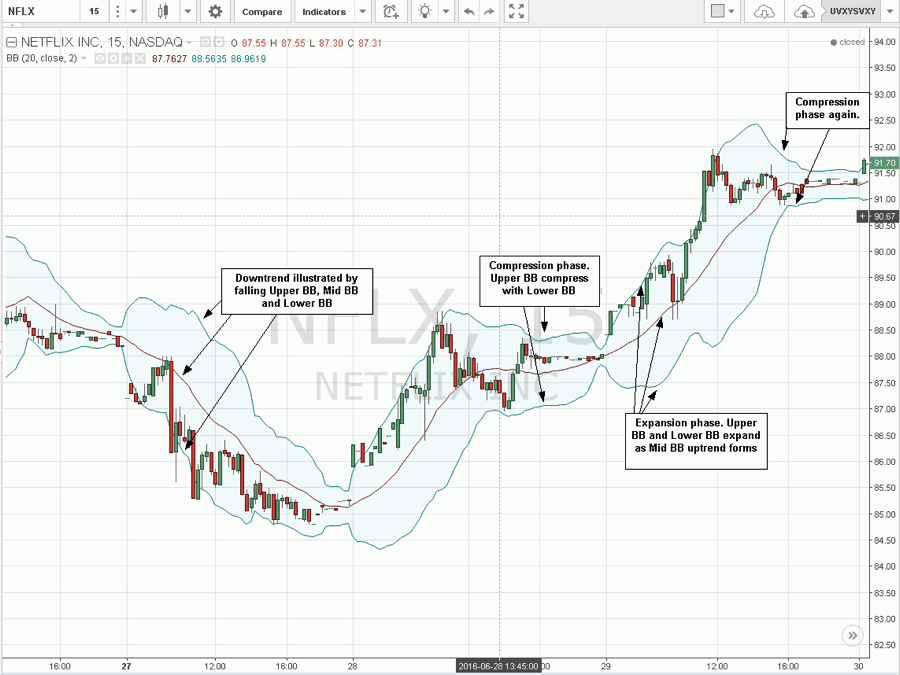
Example of Bollinger Bands used on a NFLX chart.
The Netflix (NASDAQ: NFLX) 15-minute candlestick chart illustrates the Bollinger bands. The upper BB and lower BB are shown with the blue lines and the mid BB is the red line. Starting from the left side of the chart, notice how the breakdown triggers after a compression phase in the mid 88s, followed by a gap down and rejection off the mid BB at 88 resulting in a sell-off down to mid 84s before compressing again. The compression phase turns into expansion as NFLX gaps up to 86s and proceeds to grind up towards 89.70s to form a tweezer top at the upper BB before reversion back to the mid BB near 87.50, which actually gets overshot towards the lower BB at 87. This forms another reversion back up through to the mid BB leading to another compression phase near 88 before the breakout expansion phase ultimately grinds NFLX up towards 92 followed by another compression phase at the end of the chart.
The Bollinger bands can be traded in conjunction with a momentum indicator like a MACD, RSI or Stochastic to time precision entries on mid BB breaks or rejections using the subsequent upper or lower BBs as a price target. Traders can opt to use price tests or an actual candle close. The latter is a better way of confirming a true break, but can also result in a lagged entry or exit. Smaller time frames can be used all the way down to a 1-minute chart for traders wishing for an earlier trigger confirmation. However, be aware that the shorter the time frame, the more prone it can be to wiggles as well as a small trading range.
Alternate Bollinger Band Settings
Seasoned traders with much experience using Bollinger bands may opt to change the default settings. For very volatile markets, changing the standard deviation to 2.618 can generate more accurate BBs that apply to the larger price swings. Adding an offset like negative three (-3) to the offset setting or changing the period setting lower allows for tighter BBs which can be used in a narrow range trading market. Traders can experiment with the settings to get better acclimated with this range tool.