
What is Momentum Trading?
Why do bank robbers rob banks? Because, that’s where the money is. Momentum traders go where the action is. Momentum trading seeks to capture profits in stocks that are making significant price moves (up or down) on heavy volume often in reaction to a news or rumor catalyst. These stocks move in an extreme and often excessive manner due to short-squeezes, margin calls and running stop-losses. Scalping quick profits with heavier leverage is the typical style of momentum traders. The high risk can be proportionate to the large rewards.
Momentum traders will trade anything with large volatility that day. Stocks that have maintained and sustained a parabolic rise are often labeled “momentum stocks” or “high-flyers”. These stocks are much more volatile than conservative blue chip stocks. The volatility attracts momentum traders spurring a spike in participants. Stocks that are in the news accompanied by gaps, heavy volume and price volatility are most attractive to momentum traders.
How Does It Differ from Long-Term Investing?
Momentum trading has very small holding periods for positions that range from second/minutes to hours. Profits and stops are taken quickly and require sharp reflexes, decision-making and iron discipline. Momentum trading focuses more heavily on technical analysis and reactions to news. In many ways, momentum trading is risk averse since exposure is limited in terms of holding time, which allows for larger position sizing for smaller price targets. This is the essence of scalping.
Long-term investing involves holding positions from months to years and relies heavily on fundamental analysis. Larger time frame charts including daily, weekly and monthly may be used to gauge general trends. Position size is much smaller since the risk increases with longer holding periods due to event risk and much larger price swings. Event risk can come directly from the company like a surprise earnings warning or from non-related situations like an FOMC rate hike. Systemic risk looms from events that may be completely unrelated to the stock like an international banking crisis or terrorist attack.
Taking Advantage of Price Movement
Price movement is the lifeblood of momentum trading. Simply put, a stock has to move to generate volume and sustain momentum. Volume and follow through are key components of momentum. Momentum trading seeks to capture profits by gaming these price moves.
Shorter Time Frames and Holding Periods
Momentum trading prioritizes shorter time frame charts like the 1-minute, 5-minute and 15-minute time periods. Focusing on the immediate action allows for heavier share sizing offset by small holding periods to manage risk. Momentum traders need precision entries and exits with instant executions made possible by utilizing direct-access trading platforms that enable efficient routing preferences and enable access to ECNs and dark pools.
More Technical Analysis Over Fundamental Analysis
Charts and executions override the fundamentals of the underlying company for momentum traders. They need speed in terms of information (news), quotes and execution and price movement. News tends to be a main catalyst for a spike in momentum, but chart patterns and indicator-based signals determine when trades are triggered.
Speed and Algorithms
Momentum traders religiously monitor various newswires to get a jump on significant news items. High frequency trading (HFT) programs are very active in momentum trading and further perpetuates the magnitude of price movement and volatility. The nimble get rewarded while the latecomers get trapped. Momentum trading is the hallmark of algorithm programs that can execute trades in milliseconds. An HFT algorithm can execute up to 300 trades in the time it takes to blink an eye. Algorithms are programmed to access news and quotes faster than humans. These programs are constantly competing, racing and leapfrogging each other to snatch liquidity. This causes rapid price moves that invite momentum traders trying to game the algorithms.
What Should Momentum Traders Look For?
Technical analysis involves and utilizes various tools and indicators. The right mix of the tools can be used to generate converging signals that improve the probability of a direction price move.
Intra-day Set-Ups
Momentum trading is generally limited to intra-day sessions since overnight positions carry uncontrollable event risk. This doesn’t rule out overnight or swing trades, but the sizing is generally much smaller. Intra-day set-ups utilizing the smaller time frames with Level 2 quotes and direct access routing are the preferences for momentum traders.
High Probability Chart Patterns
Probability is a major factor that can be used to offset some risk. If the probability for a stock to rise 25-cents is 90%, then a momentum trader may decide to use double position size for the trade. While increasing position size means more exposure risk, the high probability helps to offset some of the risk. Limiting the holding time for the double position size can further offset risk. This may not necessarily mean to exit the position completely but to scale down the size as holding time increases.
Stock volume brings more momentum trading opportunities due to higher liquidity and volatility.
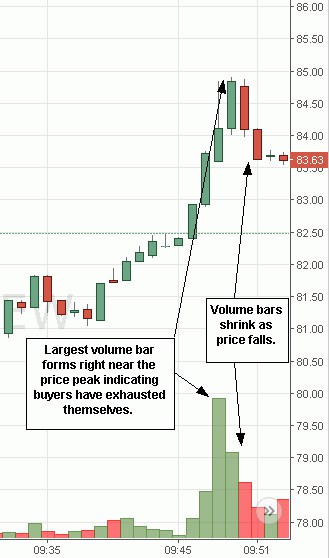
Volume
Volume helps to ensure liquidity and gets the stock “noticed”. Very heavy volume bars are also used as an indicator to determine short-term tops and bottoms. The heaviest volume bars usually form right at or just ahead of price peaks and bottoms followed by exhaustion reversions on shrinking volume bars. Volume bars help to confirm reversal candlesticks like shooting stars, bearish engulfing or market structure highs (bearish) and hammers, bullish engulfing or market structure low candles (bullish). For example, heavy volume hammer candlesticks can indicate that panicking sellers have exhausted themselves near-term, which signals momentum traders to swoop in on cheap shares causing short covering bounces.
Good Risk/Reward Ratios
Quantify the downside risk compared to the upside possible gain to form a risk/reward ratio. For example, if your stop-loss is $1 with a projected target gain of $3, then you have a 1:3 risk/reward ratio. Basically, you are betting the stock will rise up $3 before it falls $1. In momentum trading, the increments may be smaller, but the variables are still the same. More favorable risk/reward ratios (1:2, 1:3 and higher) allow for more exposure in terms of position size as long as holding time and probability is managed prudently.
