
Day Trading Encyclopedia
Chart Patterns Double Bottoms and Tops
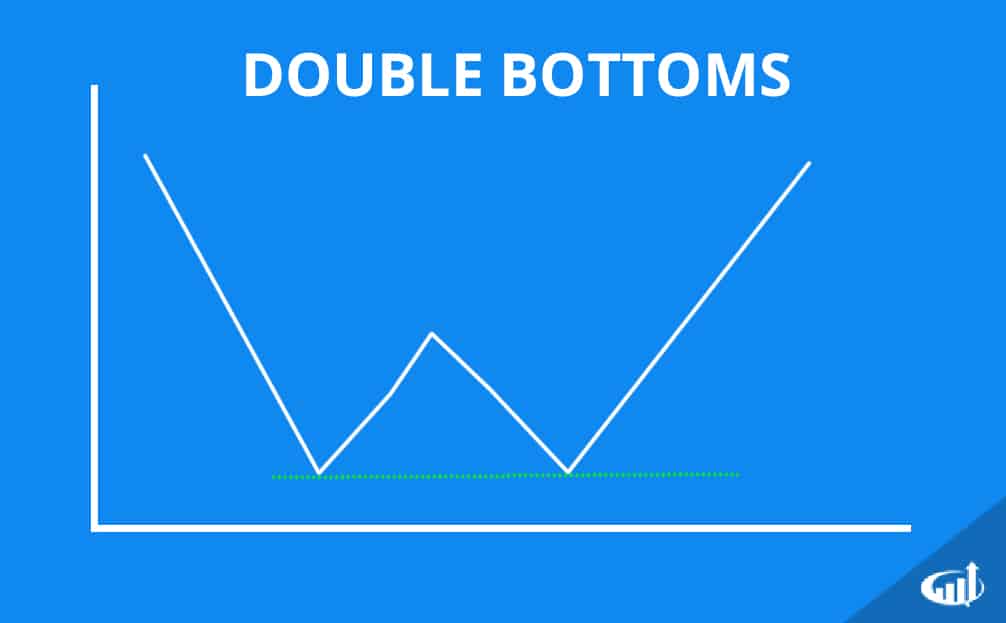
Double Bottom Chart Patterns
Double/Triple Bottoms and Tops
Double bottoms are trend reversal formations. The pattern is shaped like a W, where a new low is established, then a bounce higher. The bounce peaks and falls again to re-test the first low range before bouncing again and breaking the peak of the prior bounce as the stock moves higher. The steeper the drop to the second support, the stronger the rebound should be. This makes a statement as anxious bidders step up the price on the bounce strong enough to trigger a breakout and subsequent up trend.
Triple Bottoms
Triple bottoms are the same as double bottoms with the exception of a second peak forming on the second bounce, then a re-test of the double bottom before the price rebounds and breaks through the prior peaks as the trend reverses into an up trend.
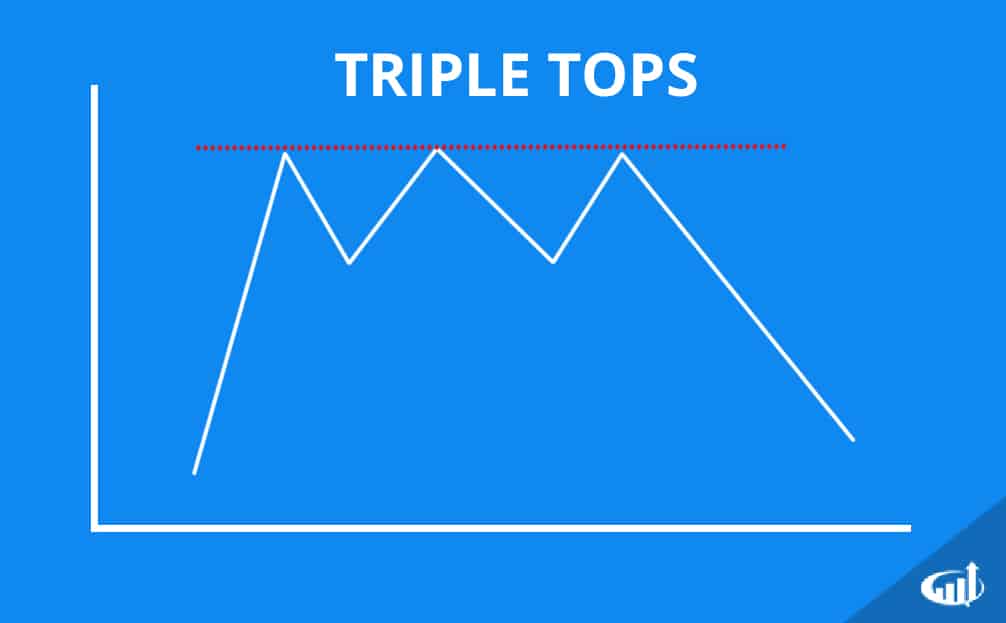
Triple Top Chart Patterns
Double and Triple Tops
Double tops are shaped like an M and result in a breakdown as the up trend peaks out twice or three times for triple tops. The buying sentiment sours on the second and especially the third test of the top. Triple tops are stronger reversal patterns since the buyers failed three time to breakout which means more longs are trapped in the position when it eventually breaks down through the valleys.