
Day Trading Encyclopedia
Fundamentals Income Statements
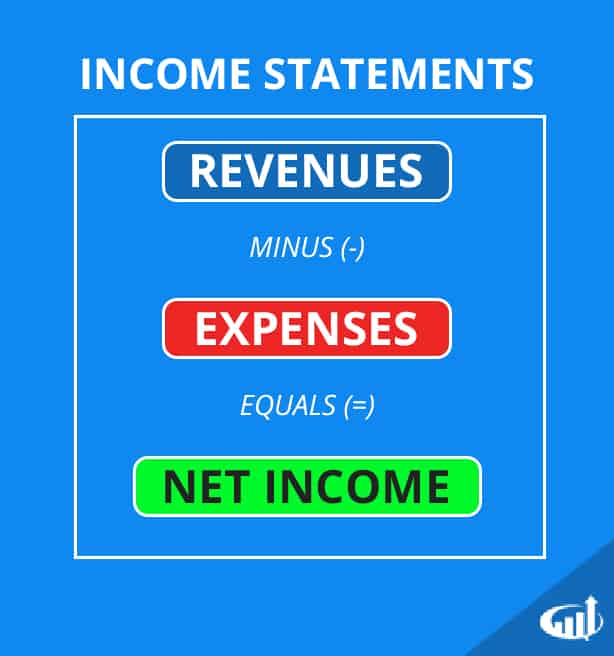
Income statements show a company’s “bottom line,” the amount of income they generated for the period
Income Statement
The income statement shows the profit or loss generated for a specific period of operations. The statement reports total revenues minus cost of revenues to determine the gross profit. The itemized operating expenses including research and development, selling, general and administrative (SGA), non-recurring and others are totaled and subtracted from the gross profit to generate the operating income or loss. Additional items including interest income, interest expense, impairments, depreciation, amortization as well as sales of assets are listed and calculated to generate a net income or loss as the last time or ‘bottom line’ on the income statement.
What are Revenues?
Revenues are the proceeds collected by a company from its business operations including the sale of its products and services, royalties, assets, fees and investment income. Analysts refer to gross revenues as the “top line” results, when the companies report their quarterly earnings. Revenues growth is a key metric in assessing the improvement of a company’s business operations. However, top line results can be misleading when products and services are either sold at deep discounts to sacrifice net income.
What are Sales?
Sales are the proceeds received or due to be received by a company in exchange for its products and services. While sales and revenues are generally used interchangeably, some businesses specifically reference sales to revenue generation from the actual selling of products/services, and exclude revenues from passive investments, royalties and non-core business activities. Sales are the organic engine of a business and analysts tend to segment the pure sales numbers from the gross revenues.
Investors should also be aware of deceptive practices that inflate sales artificially like channel stuffing. This is the practice of purposely sending too much inventory to distributors beyond what they are able to sell.
Deferred Revenues
Revenues that have been collected in the form of advanced payment or prepayments for products or services to be delivered in the future are called deferred revenues. The money is collected upfront but not earned until actually delivered. This is recorded as a liability on the balance sheet, since the product is still owed to the customer. It becomes earned revenue upon delivery of product or service and posted as revenue on the income statement.
Accrued Revenues
When a product or service is delivered but the customer has yet to be billed, it is considered accrued revenue. For example, when a retailer offers to finance a purchase that the customer doesn’t have to be paying until six months later, this is considered accrued revenue since the product was delivered but not invoiced yet. This is posted as an asset on the balance sheet and then posted as revenue on the income statement upon collection of proceeds. Accrued revenue notifies investors that payment is due for purchased made, but not posted during the quarter.
What Are Expenses?
Expenses are the costs incurred by the business in order to generate revenues. Expenses is a broad category that includes all expenditures ranging from marketing, administration, rent, cost of goods to R&D, salaries and interest charges. Non-GAAP reporting excludes non-cash based expenses like restricted stock compensation to focus on the core business operations. Expenses are generally divided into two categories: Cost of Goods Sold and Operating Expenses.
Cost of Goods Sold
As the name states, the cost of goods sold is an expense that includes all the accumulated costs associated with building a product or service to be sold. Expenses including labor, materials, merchandise and payroll taxes are some of the usual items. The cost of goods sold is extracted from the revenues to determine the gross margins.
Operating Expenses
Operating expenses are the expenditures incurred by a business to perform its operations or function as a running company excluding non-production expenses under Costs of Good Sold.
Research and Development (R&D)
This expense represents the costs associated with improving, expanding and innovating a company’s existing line of products or services that can lead to the development of new products and services. Technology and biotech companies spent a large portion of revenues on R&D to insure they stay on pace with competitor’s products and procedures. Often times, this is a war of attrition within industries as companies with the largest R&D budgets gaining the edge on the competition.
Selling, General and Administrative (SG&A)
The SG&A expenses are generally fixed costs incurred by the company even if there were no revenues. These expenses include marketing, rent, utilities, subscriptions, salaries and benefits, supplies, depreciation and insurance. As a percentage of revenues, SG&A can be an insightful measure of a company’s efficiency.
Insurance
Companies carry insurance for a broad number purposes including: key man, general liability, company vehicle insurance, property insurance as well as life, health insurance and employee workman’s compensation and disability.
Marketing
Market expenses include costs associated to generate sales including advertising (newspaper, online, television and radio), media purchases, advertising and public relations agency contracts, promotions, publicity materials and sales commissions. Costs including meals and entertainment while promoting products may also be listed in this category.
What is EBITDA?
Earnings before interest, tax, depreciation and amortization (EBITDA) represent the net income excluding the aforementioned items. Like SG&A the EBITDA can be derived as a percentage of revenues to determine its profit margin. This metric helps gauge a company’s operating performance. Analysts used the EBITDA to understand how well a company is performing compared to its peers and the overall industry.
What is Net Income?
Net income represents the profits that remain after subtracting expenses and taxes from revenues. Net income is the bottom line, literally. The net income is stated as the last line on an income statement. Public companies will also post an earnings-per-share (EPS) that divides the net income value by the number of outstanding shares. Analysts use this number to determine if the company has met, missed or exceeded consensus estimates.
GAAP Versus Non-GAAP Reporting
Companies like to report both GAAP and non-GAAP income figures on earnings reports. The non-GAAP numbers always look better since it excludes various non-cash transactions including restricted stock-based compensation. Companies argue that non-GAAP numbers provide better insight into the core business operations without being distracted with items that aren’t related to the business. Most analysts tend to go with the non-GAAP numbers when providing estimates. Net income reported as EPS can be inflated when stock buybacks are used to shrink the outstanding shares. Therefore, it is important to pay attention to the actual net income reported in dollars. Analysts utilize EPS reporting to help compare against peers to gauge how they stack up in the industry as well as to gauge industry earnings trends.