
Day Trading Encyclopedia
Chart Patterns Head and Shoulders
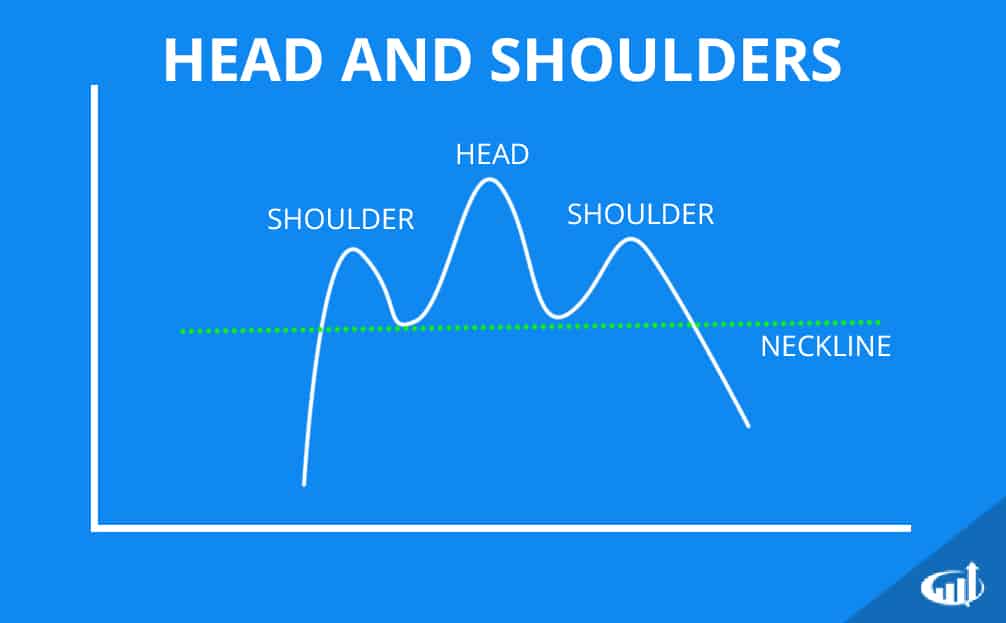
Head and Shoulder Chart Pattern
Head and Shoulders
Head and shoulders are a trend reversal pattern. It is composed of a new high followed by a reversion and a bounce to a form a higher new high price and a reversion that bounces again to form a lower high before falling again. By connecting the two lows of the bounce points, the support trend line also known as the neckline is formed. The first high and subsequent higher high is the first shoulder and head. The high of the second bounce is the second shoulder. When the price falls back through the support trend line, the head and shoulders pattern is triggered. This pattern forms when the buyers are simply exhausted and lose interest as a new downtrend forms when the support trend line is broken.
The head is the highest point of the pattern followed by the second shoulder, which should not exceed the highs of the head. The slope of the neckline is irrelevant. Once the neckline is broken, then the pattern triggers the breakdown. Once the support of the neckline is broken, it may act as resistance if the stock attempts to rally. After the breakdown, the profit target is usually the distance from the head to the neckline, which is added to the neckline.
Inverse Head and Shoulders
This is the opposite of the bearish head and shoulders pattern. Instead of a breakdown, it forms a breakout. The first shoulder forms when the downtrend makes a new low before bouncing to a peak, which starts the neckline formation. As the price falls back down through the old lows and makes a subsequent new low forming the head as it rebounds again to peak at the neckline before falling again to a higher low which is the second shoulder. The bounce off the second shoulder than breaks through the neckline to trigger the inverse head and shoulder pattern that reversals the trend back up. The target is the distance between the head and the neckline added to the neckline.