
What is Volume in Stocks?
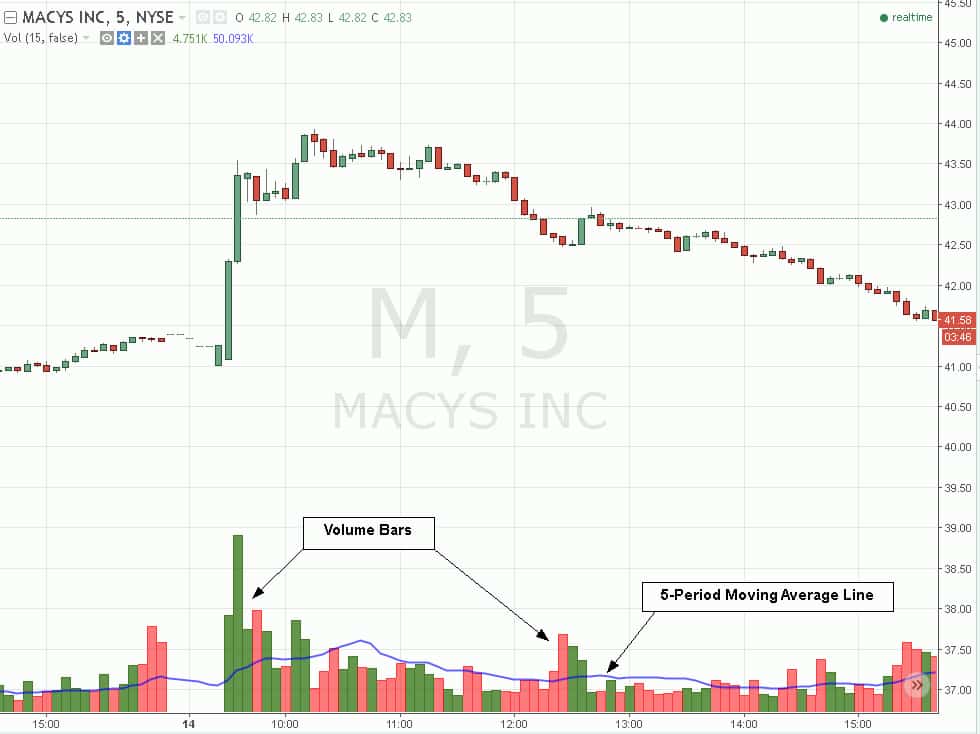
Stock Volume on a Chart with a Volume Moving Average
Volume is counted as the total number of shares that are actually traded (bought and sold) during the trading day or specified set period of time. It is a measure of the total turnover of shares. Each ticket represents a trade and counted towards the total trading volume. While the same shares may be traded back and forth multiple times, the volume is counted on each transaction. Therefore if 500 shares of XYZ were bought, then sold, then re-bought and then re-sold again resulting in four tickets, then the volume would register as 2,000 shares, even though the same 500 shares may have been in play multiple times.
Where To Find Volume on a Chart
All trading/charting platforms can visually display volume throughout the trading day usually at the bottom of the price chart. Volume is typically displayed as a vertical bar representing the total volume for the specific incremental charting time period. For example, a 5-minute price chart would display volume bars displaying the total trading volume for each 5-minute interval. Volume bars are usually colored green or red. Green represents net buying volume while red represents net selling volume. Some traders prefer to measure the volume with a moving average to spot when volume is relatively heavy or thin.
Trading Volume versus Dollar Volume
The trading volume is a measure of the total shares that have changed hands for a specific time period. The dollar volume is the total value of the shares traded. Dollar volume is calculated by trading volume multiplied by price. For example, if XYZ has a total trading volume of 100,000 shares at $5, then the dollar volume is $500,000. Money managers use dollar volume metrics to determine whether a stock has enough liquidity to support a position. Dollar volume can also be used to get an idea of money flow when scanning for stocks breaking out or breaking down that are generating the highest dollar volume during the day.
Why Does Volume Matter?
Volume is the lifeblood of any stock. It represents the interest in the trading activity of said shares. Heavier volume indicates heavier interest and vice versa or lighter volume.
A rise in volume tends to kick off significant price moves in many cases, however it is not a requirement. Despite conventional thinking, breakouts or breakdowns don’t always require heavy volume especially in this age of algorithms that know precisely what price levels will efficiently trigger significant movement. Many traders have gone bust shorting ‘light’ volume breakouts that continue to grind higher despite the lack of sustained heavy volume.
The cliché “Never short a dull market.” plays right into this. Often times, the heaviest volume bar forms at the peak of the move. It indicates the last of the chasers. This is why heavy volume hammer and shooting star candlesticks can form highly effective reversal signals. Volume analysis should be used in the context of the trading market environment with other supporting technical indicators. To determine if the volume is trading heavier or lighter than normal, traders can refer to the relative volume figure.
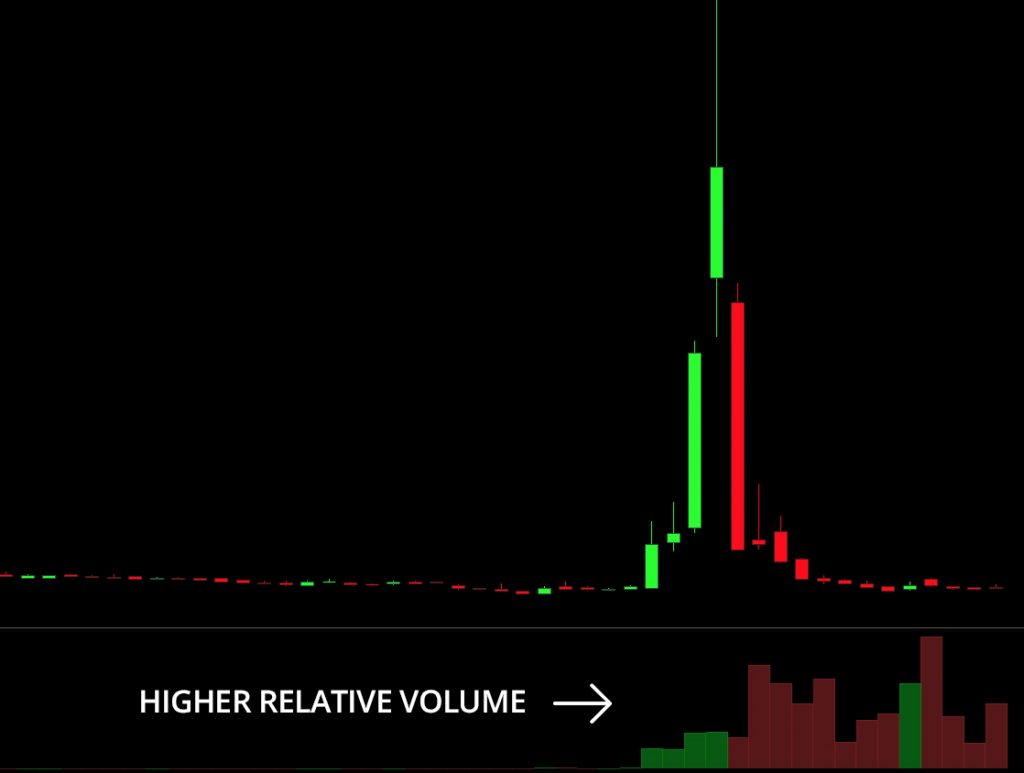
Higher Relative Volume can bring volatility to a stock and make it easier to move.
What is Relative Volume and Why Does It Matter?
The relative volume compares current volume to the “normal” volume and displays it as a multiple. The normal volume is the average volume for that given period of time for a past-specified number of days. When the relative volume is 2.5, it indicates that the shares are trading 2.5 times the normal volume. This reveals an increase in trading activity that may lead to a significant price move. Relative volume is available on most trading/chart platforms. A surge in volume can indicate money flow into or out of a stock, which indicates action.
What Does Liquidity Mean?
Liquidity refers to how much the market can absorb either buying or selling without making a market impact. How many shares can you buy or sell without moving the price of the stock? Liquidity overrides price. This is especially true for large stock traders and fund managers. High frequency trading programs and smart algorithms detects large orders and can possibly front run the orders causing traders to chase entries and exits.
For example, If you own 100,000 shares of a stock currently trading at $8 with an average daily volume 1 million shares, you may cause the stock to fall to $7 when selling the shares in a single session, resulting in an average selling price of $7.50. So while the value of the position is worth $8 million, the actual value of the position is $7.5 million. There was a $500,000 market impact or slippage to liquidate the position. Although the whole stock decline may not be solely due to your selling, remember that algorithms will sense your motivation to liquidity and continue to lower the bids and thin out the liquidity until your selling is completed. Selling begets selling. This is why professional funds and money managers assign large transactions to market makers to ‘work’ the orders to incur the least amount of slippage costs from market impact.
