
Day Trading Encyclopedia
Level 2 Supply and Demand
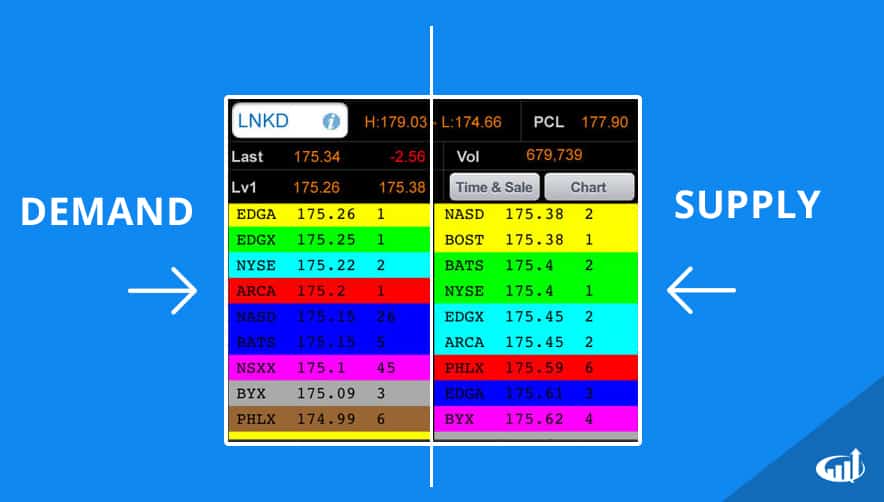
Level 2 screens show the supply and demand of the market.
Supply and Demand
The level 2 window usually displays the level 1 information at the top portion including last price, level 1 inside bid and ask, last trade and intra-day high and low. Just below the window is split into two parts. The left side of the level 2 window contains the bids usually color by price level. The best/inside bid is displayed along with the market makers or ECNs with their representative share size and time of the post. This side represents the demand.
The right side contains the supply, which include start at the best ask/offer price, size and time of post. The price levels are segments by color/shade in order of lowest price at the top (best ask/offer) on down to the highest ask prices. These are constantly changing as the price of the underlying moves up and down. Traders should keep in mind that the level 2 screen is not always representative of the true supply and demand.
Often times there may only be a 100 share size shown on the level 2 but the real size could be much larger. These are called reserve prices, meaning they will fill at 100 shares at a time but the true amount is the reserve order, which must be filled before the price level can clear. There are also hidden orders, which do not display on level 2 screens, however, they will show up on the time and sales window when they are executed. The purpose of these quotes is to minimize market impact and not disturb momentum. If a stock is climbing, then it’s important to maintain that rising momentum by not placing too much size on ask or else the bidders may pullback to wait for a cheaper price since the ask size may represent and oversupply. Placing a 100 share reserve order to sell 5,000 shares makes a much smaller impact than placing the full 5,000 shares on the ask.