
Is it possible to be 100% certain in a trade?
We’ll get to the answer but first let’s set the stage.
You’ve probably experienced something like this before. You study your patterns, run your scans, and find the perfect setup. You enter a position convinced the stock is about to break out and BOOM – 10 minutes later sellers come in and the breakout is rejected. Just when you thought you figured out trading, everything you know is flipped upside down.
Now you’re left to answer the question, “what happened?”
The Nature of Chart Patterns
It’s important to remember that the patterns we trade are considered “high probability” chart patterns. This doesn’t mean they are guaranteed. “High probability” simply means that the stock is more likely to X then Y. If a stock has a 75% chance of breaking out (high probability) it still has a 25% chance of failing.
It’s also important to be aware of market trends and conditions. In certain market environments, breakouts may be more likely than others.
Can You Anticipate Failed Breakouts?
Let’s start by answering the introductory question, “is it possible to be 100% certain in a trade?”
The short answer is “no.”
Traders don’t have the luxury of certainty. What we do have is the ability to notice trends, control risk, and increase the probability of success. We can do this by distinguishing between failed and successful breakouts and using those insights to modify our trading strategies.
Watch the video below for insights and real chart examples.
Here are a few things to consider.
Reacting vs. Anticipating
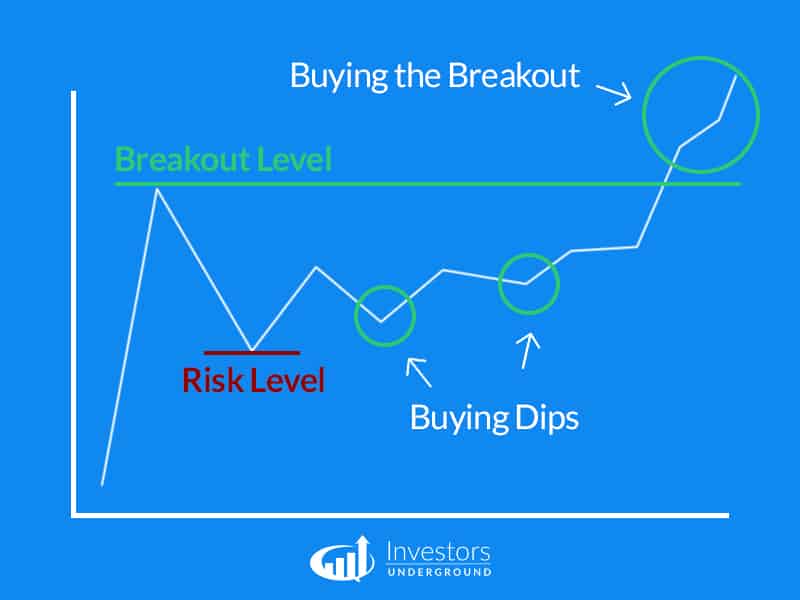
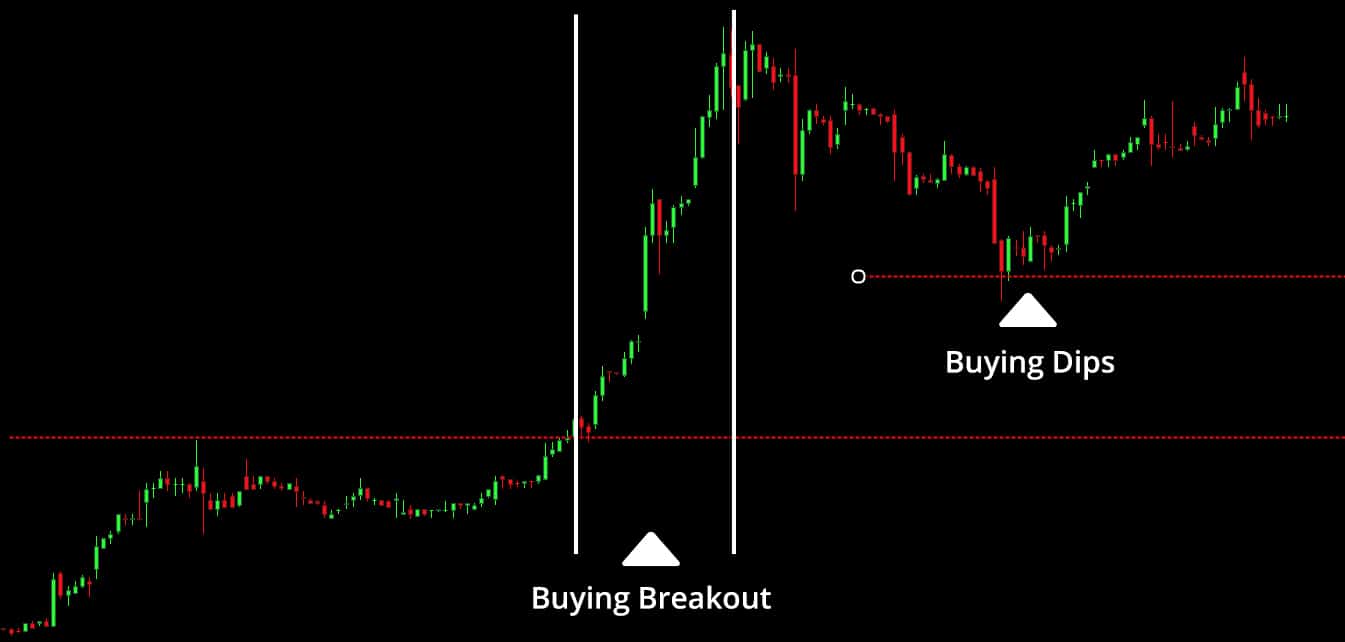
9 times out of 10, you don’t want to be buying a breakout AT the breakout price. This approach exposes you to the risk of buying a stock at its highs.
You can lower your risk by anticipating a breakout. With this approach, you would buy a stock before it breaks out, meaning you get a better entry that gives you the padding you need to make the trade work.
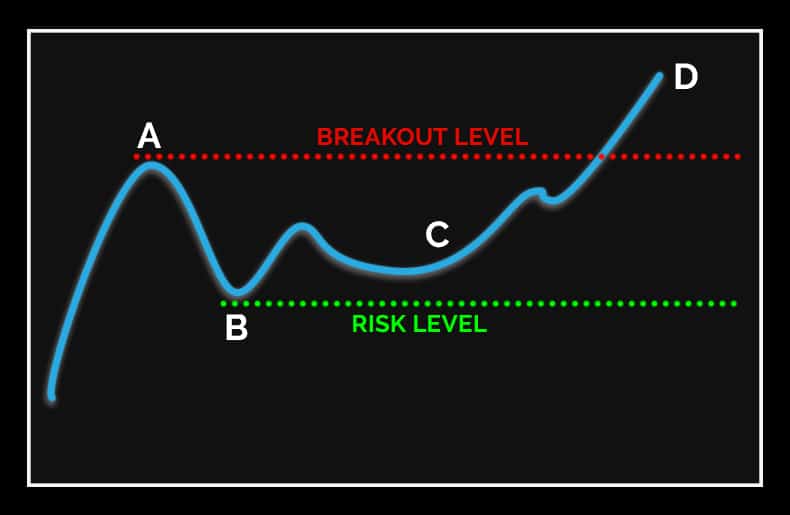
Take the ABCD pattern for example, where “A” is the breakout level, “B” is the risk level and “C” is the entry point. Notice that “C” is NOT at the same level as “A.” The entry point “C” is an anticipatory entry closer to “B.” If the stock breaks out, great. If it doesn’t, the downside is minimized (when compared to an entry at the breakout point).
Sell Into Strength
You’ve probably heard the expression, “take the path of least resistance.” In trading, this is quite literal.
Stocks will often rally into resistance points (i.e. high of day) before rejecting the price level. These rallies present great selling opportunities where you can part or all of your position.
Remember that resistance levels are price levels where sellers overpower buyers. It’s more likely that these levels will hold than break. If you’re assuming a breakout is coming, you could be overstaying your position. It’s better to assume failure and be surprised by a breakout than vice versa.
This isn’t to say you should never hold through a breakout, but you should be aware of the probabilities going in. If your anticipatory entry yields some nice profits by the time the stock approaches the breakout point, it would be wise to lock some of those gains in.
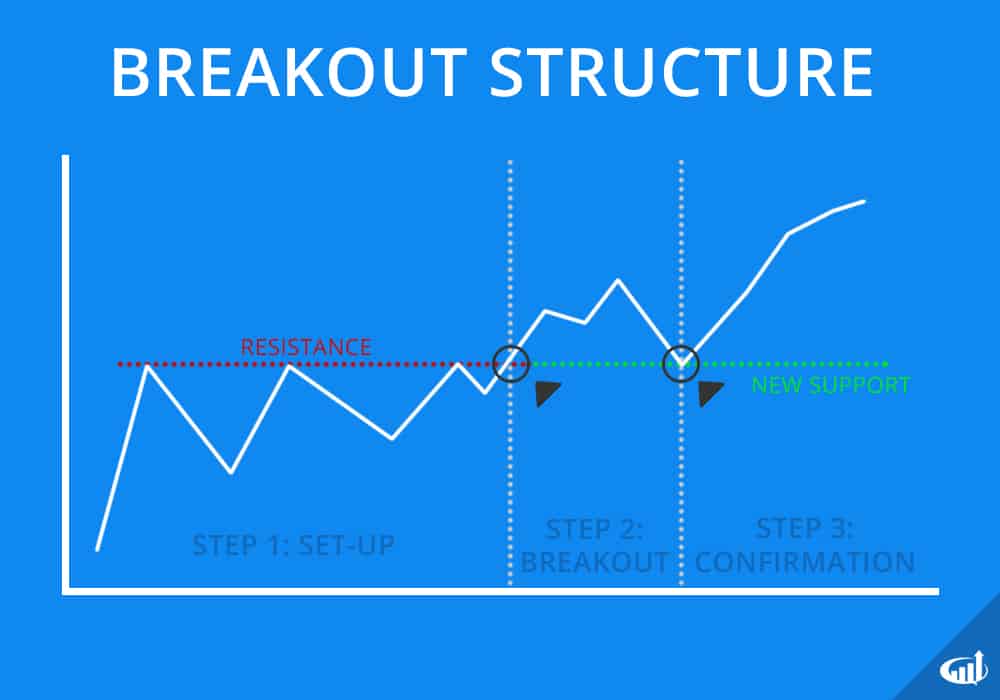
Confirmation of a Breakout
Many traders assume that after a stock breaks out above a resistance point, the breakout is in play. This is only half true. There’s a second indicator to be aware.
Traders need to look for confirmation of a breakout. Confirmation of a breakout occurs when prior resistance turns into new support. For example, if a stock breaks out above a $5 resistance point, that $5 price point should act as support. If the stock breaks out above $5, hits $5.15 and heads back down below $5, the breakout has failed.
There are two key insights from this analysis:
- If the breakout fails, consider selling. The failed breakout may allude to a move lower.
- If the breakout confirms, another entry opportunity presents itself.
Point two speaks to another approach traders can take. Earlier I recommended selling some of your position into strength (rallying into resistance). If the breakout confirms, you can add to your position with higher certainty. You’ll be buying shares at a higher price in exchange for higher certainty.
Questions and Examples
Have any questions about anticipating failed breakouts? Examples of chart patterns that illustrate the point? Post them in the comments below!


Most informative and helpful breakout strategy..Thanks
What does VWOP mean?
I think you mean VWAP and it stands for volume weighted average price.
It is an indicator you can turn on to your chart. Look for indicators on your chart software and click on VWAP. It will add a line on the chart. when the prices crosses that line up or down it gives you an idea on either buy or sell. Most people I follow use it.
mas informacion por favor
thanks guys !
Thanks Nate great video!
Hi, I am new and learning how to read the chart.
1.I wonder all resistance points has to be the exactly same price or can be a little bit different? Example, the stock hit the resistance at $ 5.76 and another move, it hit just $ 5.15, is it still called resistance? Or it has to hit at the same $5.76 exactly?
2.The same question as support, they all have to hit the exactly same price ?
3. Breakout failure, i wonder how many percentage does it has to rise above the resistance and how many percentage it has to drop below the resistance? Or anything bellow it , it is failed? Based on your example $5 is a resistance and if it hit $ 5.15 and head back down below $5, it has failed.