
Day Trading Encyclopedia
Technical Indicators Parabolic SAR
Parabolic SAR (PSAR)
The parabolic stop and reverse (PSAR) indicator was developed by J. Welles Wilder, Jr. as a tool to find price reversals which can be utilized as stop-loss levels as well as trade triggers. The notable difference about the PSAR indicator is the utilization of time decay.
How to use the Parabolic SAR
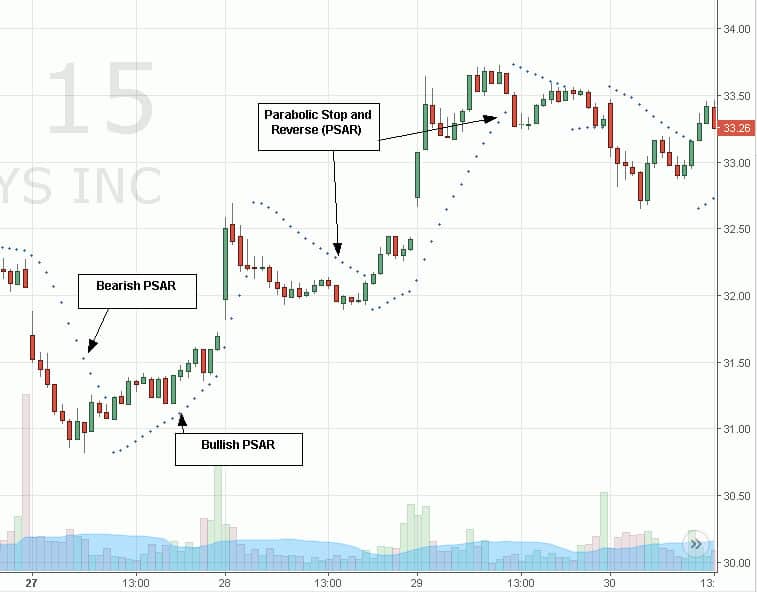
The PSAR indicator forms a parabola composed of small dots that are either above or below the trading price. When the parabola is below the stock price, it acts as a support and trail-stop area, while indicating bullish up trending price action. When the stock price falls below a single dot, then a stop-loss/sell /sell-short trigger forms. The parabola will then start to trend down as it trades above the stock price, indicating a resistance level accompanied by bearish price action. Traders can use the upper parabola break as a buy-cover/buy long trigger. The PSAR can be used in conjunction with other indicators like stochastics, candlesticks and moving averages to pinpoint accurate entries and exits.
Start Day Trading With Our Trading Simulator FREE for 14 Days!