
Pivot Points Explained
While originally developed by floor traders to indicate static support and resistance price levels based on the prior day’s trading range, pivot points are also regularly used with intra-day trading of stocks. Using the prior day’s open, high, low and close as the data inputs, a pivot point is derived through this formula:
P = Pivot Point = (Prior Day’s High + Low + Close) / 3
Once the pivot point is calculated, then two levels of resistance and two levels of support are calculated with the following formula:
R1 = (P x 2) – L ow
R2 = P + (High- L) = P + (R1 – S1)S1 = (P x 2) – H
S2 = P – (H – L) = P – (R1 – S1)
This results in 5 horizontal lines on the intra-day chart, the original pivot point and then two resistance and two support pivot points. This is the standard pivot point set-up. Some traders may opt to extrapolate up to 10 pivot points composed of five resistance and five supports.
While the pivot point levels are labeled as R1, R2 and so forth, the reality is each level is considered a support or resistance based on where the stock is trading in relation to the level. When the stock is trading above a pivot level, it acts as a support. When the stock is trading below the pivot level, it acts as a resistance. This is regardless of whether it is a R1 labeled support. Pivot points are static throughout the day.
Fortified Pivot Point Levels
Pivot point levels become even more useful when they overlap with other support/resistance levels like moving averages, PSAR or Fibonacci price points. A pivot point that overlaps with a 200-period moving average is a more fortified support/resistance level than just a simple pivot point. Add in a .618 fib level as well and it becomes a very key price level to watch. The more layers of overlapping price levels, the more fortified that specific pivot point becomes. It is prudent to spot triple fortified pivot point levels when possible.
Since so many traders follow pivots, they become significant inflection points that need to be followed just because everyone else is following the. Pivot points are often factored into algorithm and high frequency trading programs. Traders often place stop orders at or near pivot points. Most trading platforms have pivot point studies that can be added onto any chart. These are a static price tool, which can and should be combined with a dynamic trending tool like moving averages and a momentum indicator to pinpoint more precise entries and exits.
How to Use Pivot Points for Trading
As a price-based tool, pivot points commonly serve two functions. First to provide multiple price support and resistance levels (ahead of time) and secondly as a simple trend monitoring gauge. The main pivot point (P in the formula) should theoretically get the most action when tested. When the price is trading above the main pivot point, it is assumed to be in an uptrend and vice versa for a downtrend when trading below the main pivot point. Once trader’s resistance is another trader’s target. Therefore, a bullish trader may target the next pivot point level R2 for a profit target. A bearish trader may place a short-sell limit order at R2 anticipating a reversion at the resistance level.
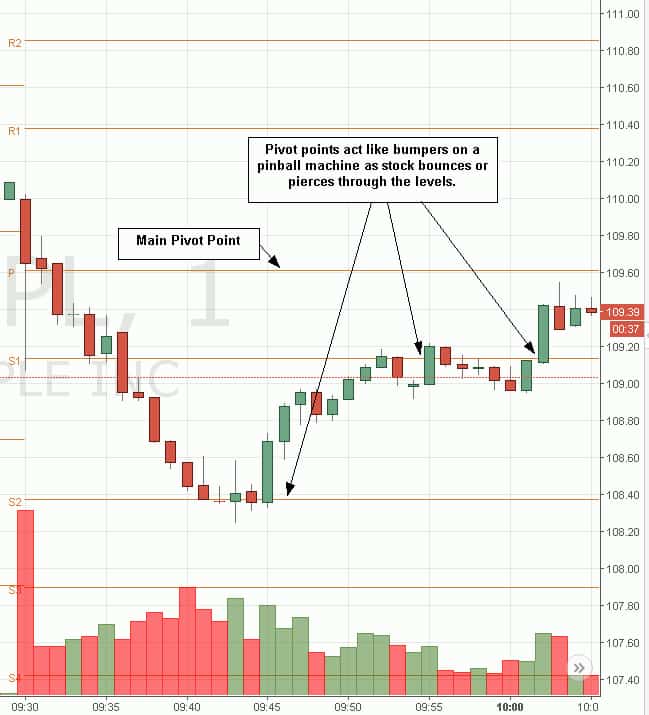
Pivot points can be used to pinpoint significant price lvels.
Support/Resistance and Target/Stop-Loss
Like any support and resistance area, pivot point levels should be monitored closely when prices approach those levels. They will result in either a deflection or break through the pivot point. These levels help to simplify limit orders on targets and stop-losses. When a stock breaks out through the R1 pivot point, the next resistance area is represented by R2. Traders can use R2 as a price target to place limit orders to exit their long position and use trail a stop-loss under R1.
Limitations of Pivot Points
Since pivot points are re-calculated daily using the prior days high, low and closing values, they are only effective for the current trading day. Therefore, only intraday traders will be able to utilize them as swing and long-term traders generally can’t. Wider time frame traders can try to calculate pivot points based on prior candle period closes if they desire. This will have to be done manually by hand since most charting platforms only calculate them based on the prior days data.
