
Day Trading Encyclopedia
Technical Indicators Money Flow Index
Money Flow Index
The money flow index is an oscillator that measures the momentum of the inflows and outflows of money for a stock over a specified period of time. It is a technical analysis charting tool found on most trading platforms.
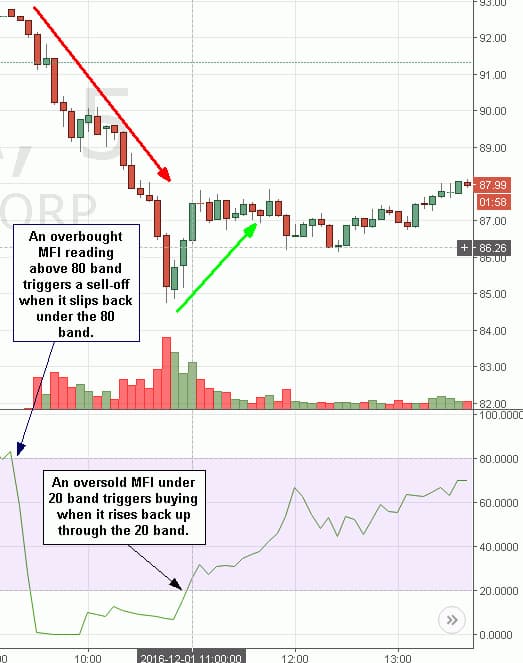
Money Flow Index Example
How to Use the Money Flow Index
Like any momentum indicator, this oscillator helps to determine whether a stock in the overbought or oversold territory to help pinpoint entries and exits. The Y-axis scale measures the oscillator from the zero to 100 levels called bands. The 20-band or below is considered the oversold range and the 80-band or greater is the overbought territory. Keep in mind these bands measures the oscillations, not the price. It is very important not to mix these two. For example, the MFI may drop from 80 to 10, which shows the stock dropping from 93 to 85, before it bounces back up to the 88 levels as the MFI approaches the 80-band area again. This doesn’t mean that anytime the stock trades at 93, it will automatically be considered overbought or when it reaches 85 it will automatically be oversold. The stock may reach 95 before it sells off again to 92 as the MFI again falls below the 20-band before bouncing through the 20-band higher, which surges the stock to 96. The MFI readings have no bearing on the pricing of the stock, it only gauges when the immediate price action is considered overbought when above 80 band and oversold when below the 20 band.
Buy and Sell Triggers
As with most momentum oscillators that use the standard 80/20 band crossover signals, the money flow index oscillator triggers are similar to stochastic, RSI and MACD. The typical buy signal triggers when the oscillator crosses back up through the 20-band. The sell/short-sell signal triggers when the oscillator falls back down through the 80-band.
Don’t Be Premature on Entries
Keep in mind that the crossover through the 80/20-bands are the actual triggers, not when the price initially enters the 80/20 band zone. This means that a stock that rises through the 80-band, it can continue to rise higher and perpetuate a short squeeze. The sell signal only triggers when the oscillator peaks falls back under the 80 band, where gravity takes over. Too many traders step in prematurely when the MFI is above the 80 band in anticipation of a sell-off that doesn’t happen until price goes much higher. The same applies when the MFI oscillator sinks under the 20-band.
Don’t make the mistake of buying too early before the oscillator crossover back up through the 20-band. The stock can continue to sell-off while the oscillator stays under the 20-band for an extended period of time. For example, the MFI oscillator makes a full oscillation down from the 80-band through through the 20-band to flatline near the zero band as the stock falls from 93 to 89 before MFI tries to bounce. A newbies trader may be convinced her is getting in “early” ahead of the crowd as he buys at 90 as the MFI bounces to the 10-band. Unfortunately, the MFI is not able to cross up through the 20-band resulting in the stock plummeting to 85, stopping out the trader for a large loss. Then MFI bounces to cross the 20-band as the stock rallies back up to 88, without the newbie trader.
The money flow index can and should be combined with price indicators like moving averages or trend lines to also gauge price support and resistance levels. The combination of a price indicator and momentum indicator can pinpoint the most accurate entries and exits for traders.