
I’d like to share with you the story of how I became a billionaire.
It all dates back to a summer day in 2000. It was a day like any other, and by chance alone, I found myself on a popular online message board after following a link sent to me by a close friend. I usually ignore these types of things, but for some reason, I was drawn to it.
The link teased of an early-stage technology that was set to disrupt the world as we know it. Hyperbolic, I know, but something told me not to shrug this one-off. There was a magnetic pull and a slight sense of serendipity.
When I landed on the message board, I discovered a meticulously organized research report that could easily pass as the work of a seasoned Wall Street analyst. The report exposed an under-the-radar technology and pointed to a single burgeoning company that was positioned to capture the majority of market share in a potentially trillion-dollar industry. What was even crazier was that this stock was only $0.01/share at the time. I couldn’t believe my eyes. I’d never seen a stock this cheap, let alone from a company that appeared to be so promising.
I was skeptical but intrigued. As I dug deeper, my intrigue quickly evolved into obsession and I found myself racking up dozens of hours researching this new company. Everything I uncovered seemed to confirm the hypothesis formulated in the initial research from the message boards. This was a once-in-a-lifetime opportunity.
It was time to invest, and invest heavily. I opened a brokerage account, transferred my savings, and pulled the trigger.
Fast forward 20 years and I now look back at that moment as one of the most pivotal moments of my life.
The stock was Apple. The rest is history.
Great story right? Yeah… but it never happened. And it never will.
Unfortunately, that’s the story many new penny stock traders tell themselves as they scour the web looking to invest in the next hot company at the ground floor.
This mentality is what attracts many traders and investors to the world of penny stocks. They see companies trading at a few cents per share (or a fraction of a penny), and they start imagining all of the potential scenarios in which a humble investment sprouts into a small fortune.
Do some people make life-changing gains by investing in penny stocks? Sure, but the odds are stacked against you (very much against you).
If you’ve been following Investors Underground for a while, you know a bit about our trading mentality. Our goal is to be smarter than the rest of the market. We focus on high-probability setups, risk mitigation, and strategic trading.
We don’t get caught up in the hype, we don’t succumb to FOMO, and we don’t get greedy.
Do you want to be a sucker chasing a fool’s chance at wealth or do you want to trade with probability on your side?
We talk quite a bit about strategies that apply to momentum stocks, most of which are small caps and large caps. In this guide, we are going to apply the same trading mentality to OTC stocks (penny stocks), so you can learn how to trade these stocks strategically.
The world of penny stocks is a “high risk, high reward” domain, so pay close attention to each and every one of these rules. They just might make the difference between capitalizing on a trending market and blowing up your account.
Understand the Nature of Penny Stocks
Before you start trading penny stocks (OTC’s), you need to understand what they are and how they differ from big-board stocks. These stocks are not the same as the Apple’s and Amazon’s of the world – not even close.
1. Accept That Most Penny Stocks Are Junk
First things first, it’s important to recognize that most penny stock companies are penny stock companies for a reason.
These aren’t early-stage companies that are about to take off. Most of these companies don’t have viable business models and many won’t generate a single cent in revenue. Ever.
To put it bluntly, 90% of these companies are complete junk (and that’s a generous estimation).
Don’t believe me?
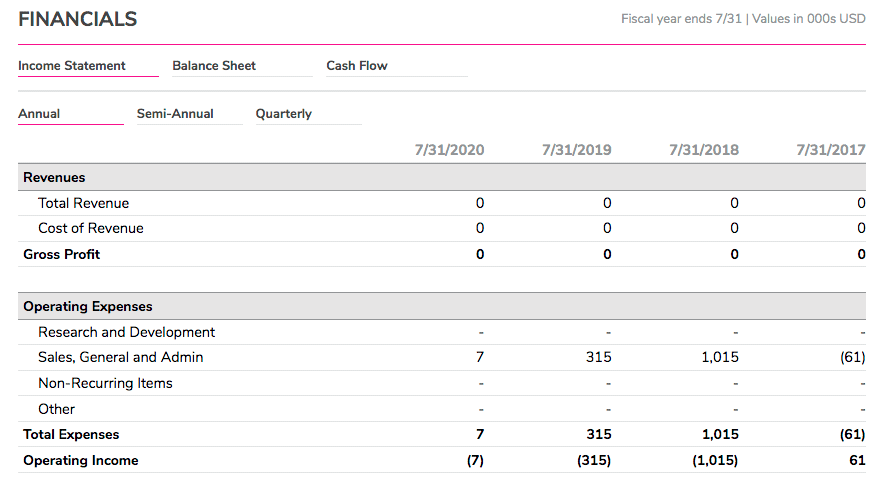
This is what most of the companies’ income statements look like (if they even bother to stay current with their reporting).
Company headquarters? Often in strip malls or small office suites.

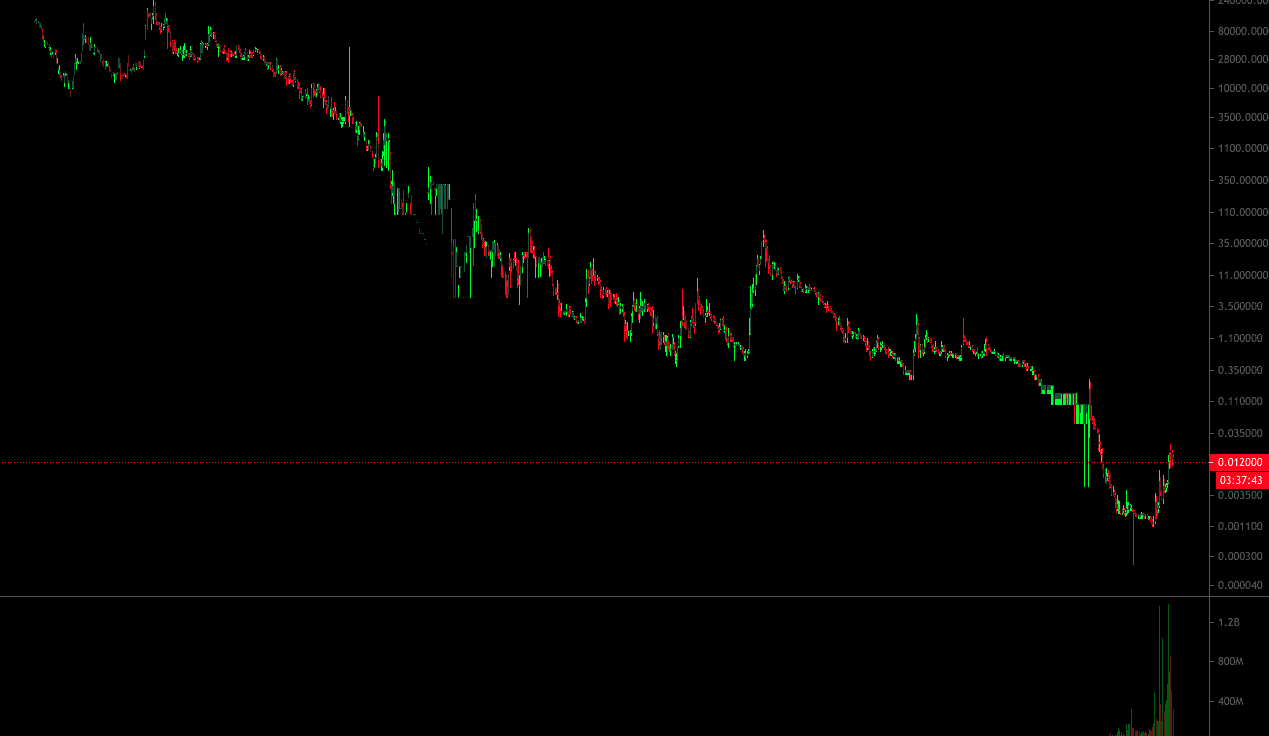
Stock charts? On a perpetual ride down to zero.
These examples aren’t outliers. This is the norm in the world of OTC stocks.
If you are looking for a standout company that defies the odds, you are fighting an uphill battle; you are looking for a needle in a haystack.
As traders, we are focused on trading high-probability opportunities. It’s essential that you carry that prudence over to penny stock trading.
2. Trade, Don’t Invest
Penny stocks are trading vehicles. They are not investments.
As stated above, most of these companies are junk and will grind their way to zero over time. As the classic investment advice goes, “know what you own.”
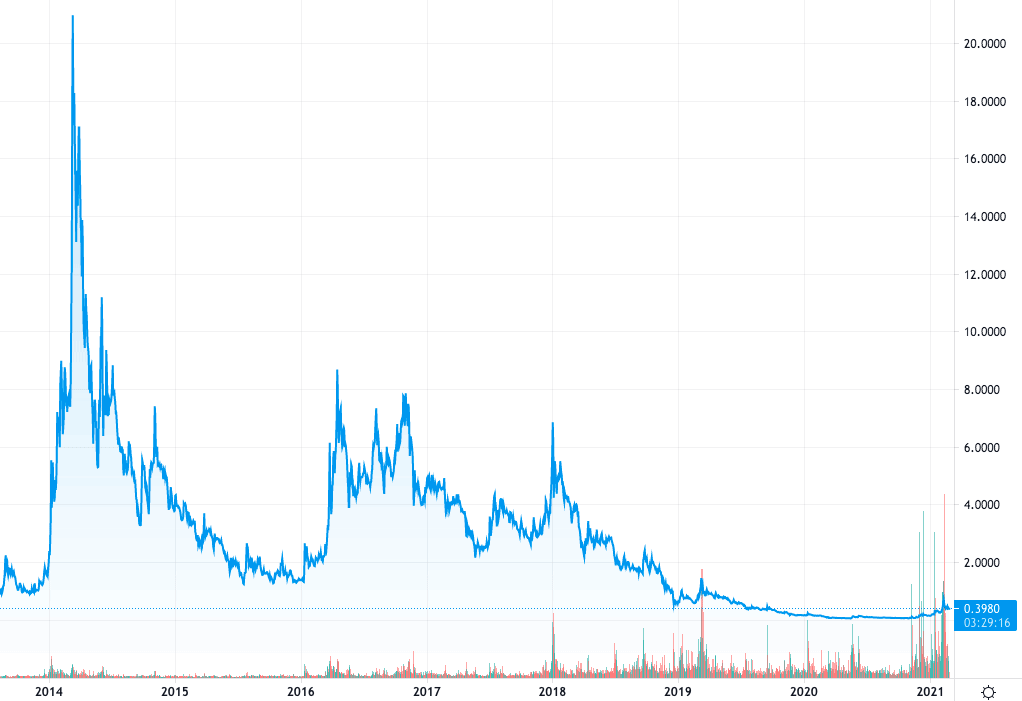
Look at the chart of just about any popular penny stock over the past 10 years – it’s not pretty. The majority of penny stocks are trading at a fraction of the price they were trading at 1 year ago, 5 years ago, 10 years ago, and so on.
For every penny stock that has a positive 10-year return, there are 1,000 that have lost 90% of their value.
It’s easy to get sucked into the story behind each company.
“But this company has game-changing technology…” “This company just signed a deal with Walmart….” “This company is going to tap into a multi-gazillion dollar industry…”
Stop.
It’s not going to happen.
Play the momentum, trade the ticker, and move on.
3.Recognize the Cyclical Nature of OTC Markets
OTC Markets are cyclical in nature. They may be hot for a few months and completely dead for a few years.
Pay attention to the strength of the market as a whole. When the OTC Markets are hot, it’s not uncommon to see dozens of stocks moving 100%+ in a single day. Volume is pouring in and massive breakouts can sustain for days or weeks at a time.
Eventually, the fun ends and the markets slow down. Make your money and bail. Don’t be the one left holding the bag.
Signs of a hot OTC market include:
- High volume/liquidity
- Big moves from multiple stocks every day
- Hot sectors
- Multi-day breakouts
4. Be Cautious With “DD”
Naive penny stock traders pride themselves on their due diligence (DD).
They spend hours going through a company’s financial statements, social media accounts, management team LinkedIn profiles, and so on.
“The CEO’s mom’s cousin used to work for a guy whose uncle worked at Intel so this company has major connections” Right….
While any form of diligence in the stock market is respectable, it’s not always constructive. The problem is that many “researchers” go into the process looking to validate their initial hypothesis and simply find the info they need to back it up. It’s a confirmation bias at its finest.
The deeper you dive into a company, the more you get sucked into the story.
Stories are fun, but the numbers don’t lie. Stock charts and financial statements tell the only story you need to know when it comes to penny stocks.
5. Ignore Hype and Message Boards
Penny stocks are prime targets for hype (i.e. “pumping” a stock). Penny stock traders love to pump their picks on Twitter, iHub, Reddit, and other message boards.
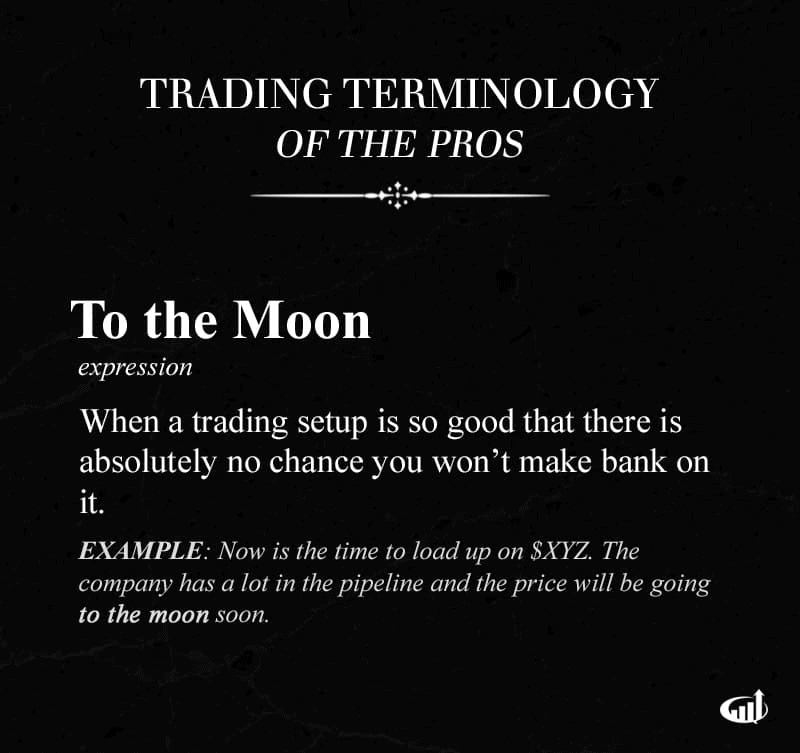
These traders even have their own lingo. Phrases like “to the moon,” “load the boat,” and “potential ten-bagger” flood the message boards.
Hype isn’t entirely bad. In fact, it fuels most of the moves that we want to take advantage of. Your job is to avoid buying into the hype.
It is helpful to recognize how hype may impact other traders, but don’t let it impact you.
6. Be Smarter Than the Rest of the Market
To sum up the points above, it’s your job to be smarter than the rest of the market. Do you think most of the traders pumping stocks and “DD” on social media sites are millionaire traders? They’re not.
If you follow the masses, you will get the same results they do. You will end up being the sucker holding the bag when the party is over (and the party always ends).
Learn How to Choose Your Stocks
Now that you know how penny stocks operate, it’s time to discuss a few rules for stock selection.
7. Focus on Themes and Sectors
Penny stock moves are often fueled by hype, and a hot sector can serve as the gasoline that sets a blaze to the market. A hot sector serves as the foundation for a hype-based trade thesis. The sector or theme is the catalyst that starts the move.
- MJ Legalized? This company is about to kill it.
- Gold hitting new highs? These mining companies are about to explode.
- Crypto on fire? This blockchain company is cashing in.
Recognize the hot sectors so you can better understand which companies are prone to breakouts. Why waste your time trying to uncover a hidden gem in the tech space when MJ stocks are going wild?
Take the path of least resistance.
Recent hot sectors include:
- MJ
- Crypto
- Shrooms
- Clean energy
- Drones
- Etc.
Stocks in these sectors have experienced massive moves from as little as a trivial press release.
Focus on what’s hot and join the trend.
8. Focus on the Fuel
It’s important to understand why a stock is running, as this explanation can allude to the staying power of a move.
Always ask yourself – what is fueling this move?
Did the company just release a PR? Is the stock being pumped on a social media site? Is a chat room alerting a stock? Is the move purely technical?
The answers to these questions will help you better understand the legitimacy and strength of the move. For example, a news story may circulate for days and provide fuel for a multi-day runner, whereas a promotional email may help pump the stock one day before it dumps the next.
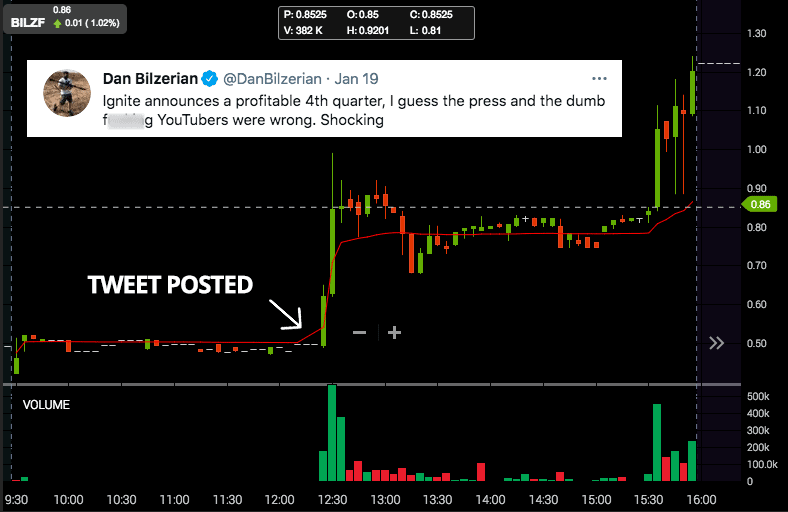
Here’s an intraday move triggered by a tweet (100% move – failed the next day):
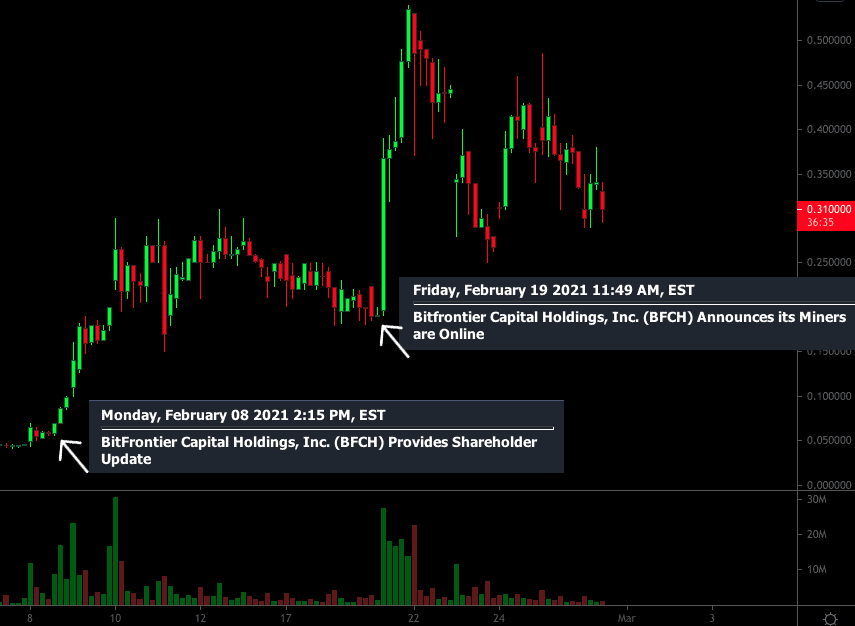
Here is a multi-day move fueled by multiple press releases (1000%):
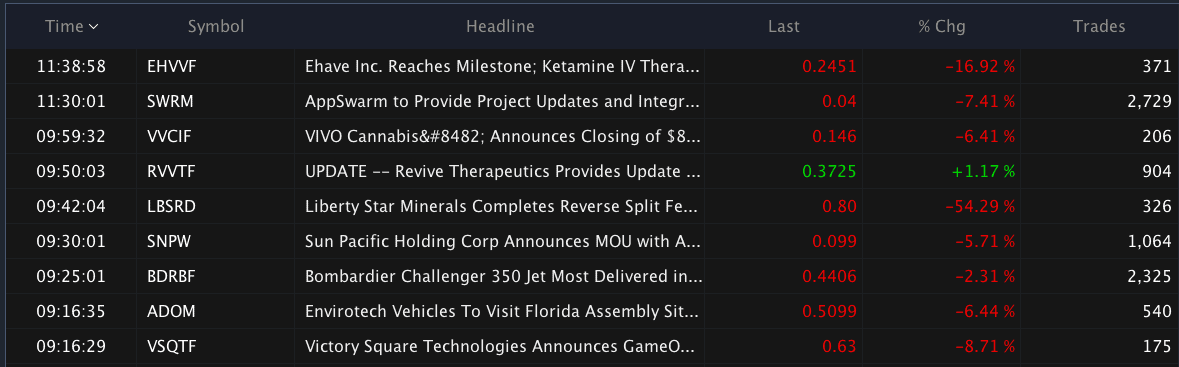
9. Look for News
Press releases are one of the best forms of fuel for a penny stock breakout. It’s one thing to read a stranger’s “DD” on a message board, it’s another to hear news directly from a company.
It’s not uncommon for stocks to run 100%+ in a few minutes on a single press release.
Many companies recognize this and “play the game.” They sustain the hype surrounding their stock by putting our press releases that feed into the frenzy. It’s no coincidence that many companies release news right when their stocks are breaking out.
Once again, we are traders, not investors, so we are not trying to analyze the material impact or legitimacy of the news. Instead, we are focused on how the market may react to it.
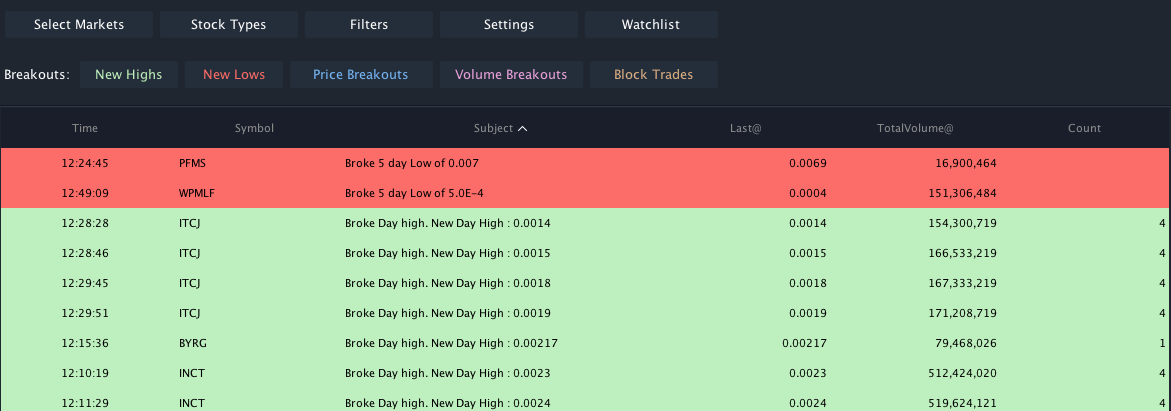
10. Look for Volume
Penny stocks are notoriously illiquid. It’s not uncommon to see bid/ask spreads of 20-30%+.
Penny stock traders need to follow the volume. Volume fuels moves and offers the liquidity you need to efficiently navigate in and out of positions.
Furthermore, volume represents interest in a stock and may support a stronger breakout. Would you rather have 100 traders interested in buying a stock or 100,000?
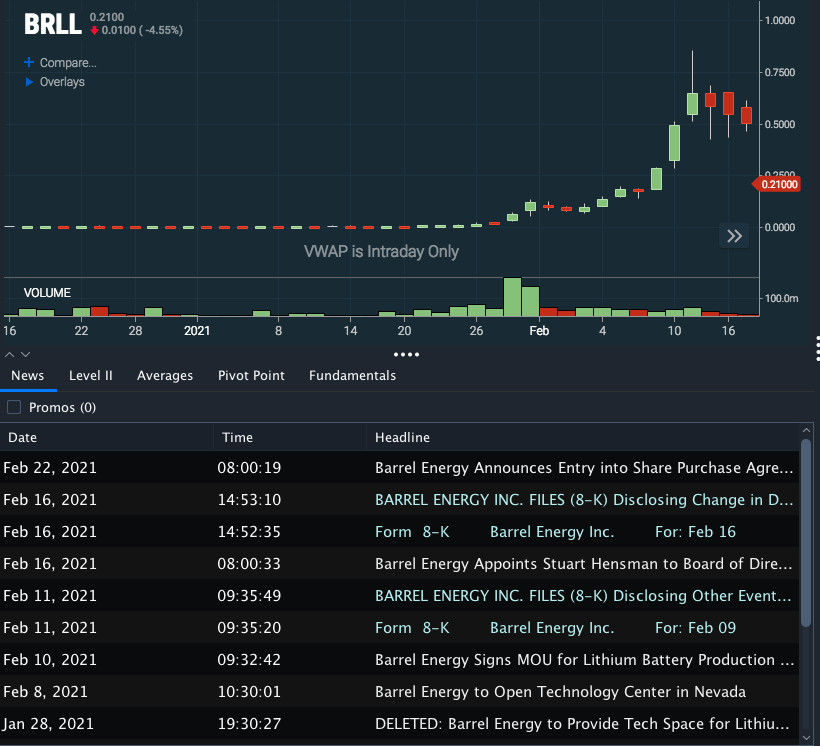
Here’s an example in which a stock mysteriously traded billions of shares at .0001 and .0002 for weeks before running 3,000%.
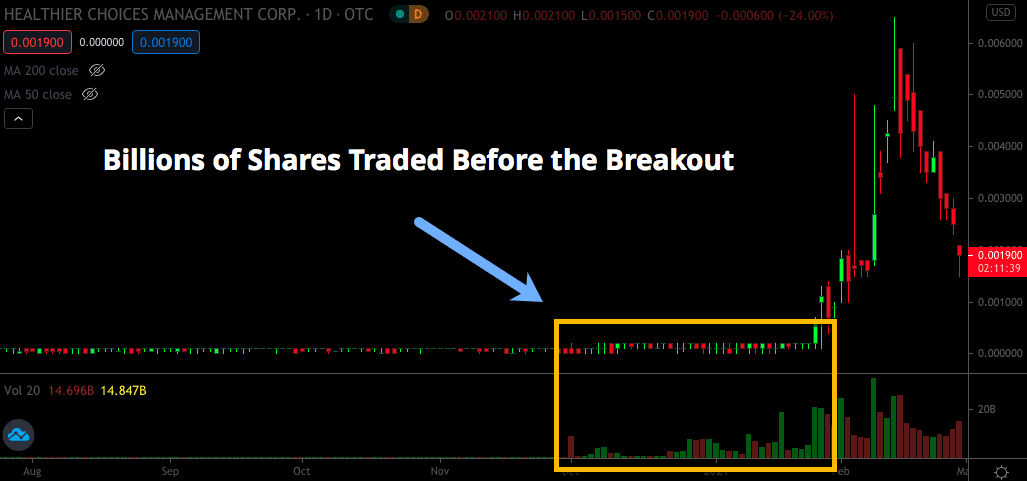
Volume tells a story.
Analyzing volume is just as important as analyzing price. Pay attention to how a stock reacts to volume:
- How much volume is needed to support a 50% move, 100% move, and so on?
- Which side of the trade does the volume favor?
- Are traders plowing through shares on the ask or dumping shares into the bid?
- Is volume higher on green days or red days?
This analysis will help you understand the sentiment of the market so you can better predict a stock’s future price movement.
11. Look Left
Technical analysis is the art of using historical data to predict future price action.
It is imperative that you absorb as much historical data as possible so you can make a valid hypothesis.
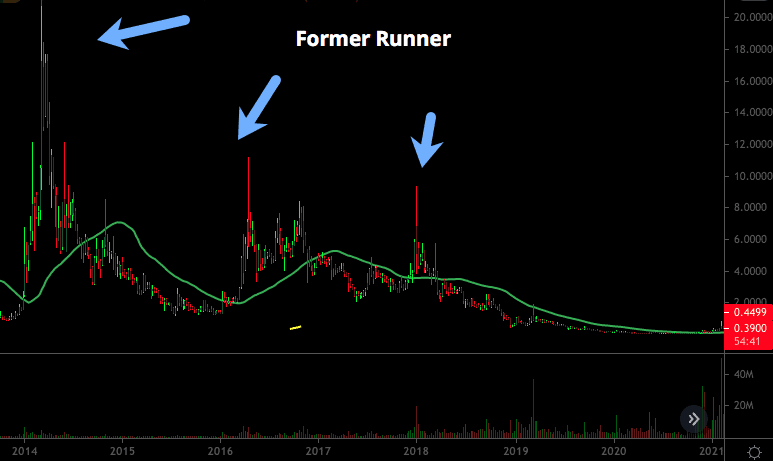
Always look left on the chart. A stock’s history can allude to its future.
For example, look at the MJ stocks that ran in 2014, 2016, and 2018. A lot of those stocks are the same ones that are running in 2021. These are known as “former runners” and traders remember these tickers when it comes time to trade the MJ craze every couple of years.
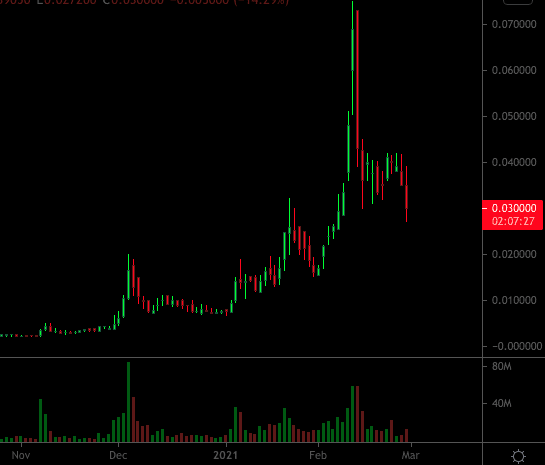
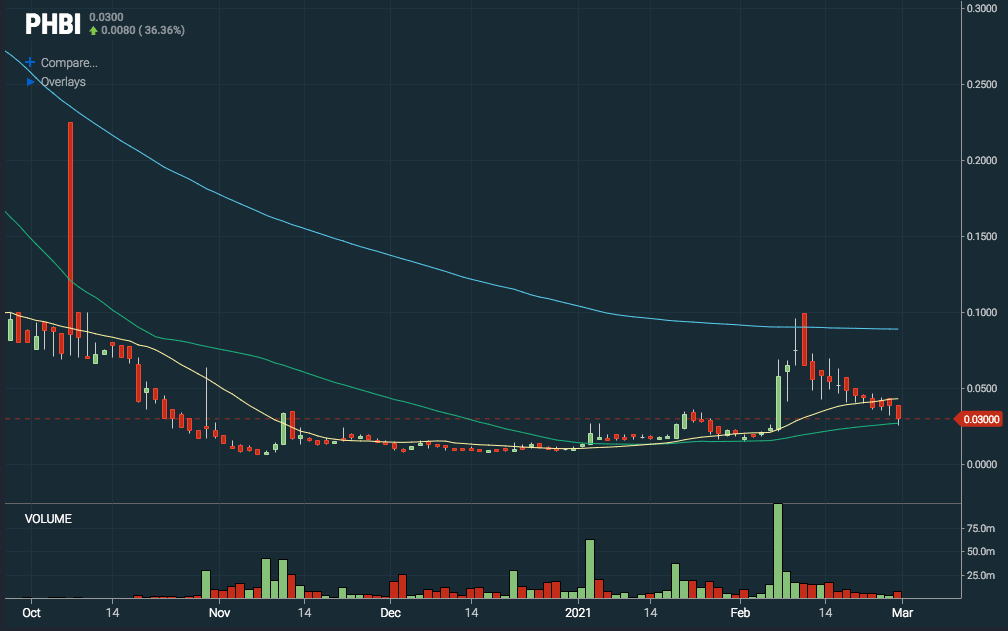
Here’s a zoomed in look at another MJ stock move in 2021:
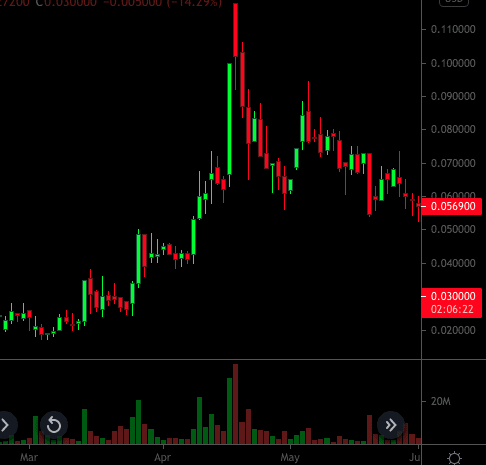
Here’s that same company in 2016:
And once again in 2014:
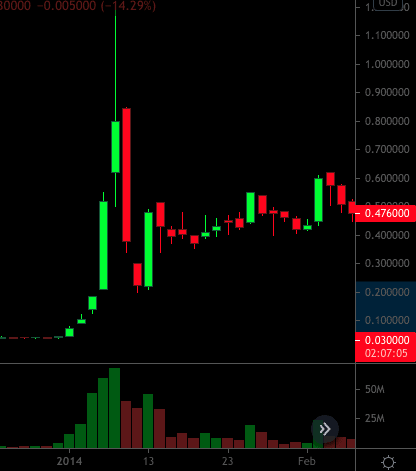
Obviously, the stock has been on a long-term decline, but every time the MJ sector is hot, this stock pops with it.
The insights you can garner from looking left are endless. Does a stock spike one day and fizzle the next or does it experience multi-day breakouts? Is a stock prone to 20-30% moves or 200-300% moves?
Gather as much data as possible so you can formulate an educated trade plan.
12. Check the Share Structure
Supply and demand control the market. When demand (buying volume) exceeds supply (selling volume), prices increase. When supply exceeds demand, prices decrease.
Supply and demand levels fluctuate daily, but there is another factor at play – total supply. The total supply is the number of shares issued by a company (known as shares outstanding). The float represents freely traded shares.
These share counts can impact the way a stock trades.
OTC stocks are notorious for issuing ridiculous amounts of shares. It’s not uncommon for a company to have billions of shares outstanding.
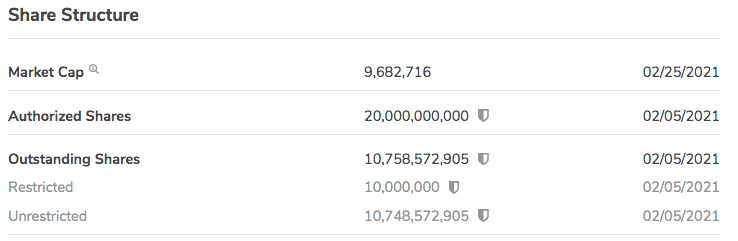
Think about what this means for a stock. If the total supply is 5 billion shares, it will take a lot more buying pressure to move the stock.
This doesn’t mean that companies with high outstanding share counts can’t move, but it does mean that they will require more volume to do so.
13. Check for Debt and Dilution
Speaking of supply, it’s important to understand just how freely companies are issuing shares.
Companies will often issue shares to raise money.
These shares will eventually find themselves on the public market and may hinder the momentum of a move.
Let’s illustrate by example. A stock is trading at $0.05/share and the company is in dire need of cash. They issue 10 million new shares to an investor at a discounted rate of $0.03/share in exchange for $300,000. The investor decides to start unloading millions of shares at $0.06/share as the stock starts moving up. What’s it to the investor? They just doubled their money.
Multiply that by dozens of similar offerings and you can see how supply may flood the market and keep a stock’s price down.
Details of a company’s debt and warrants can be found in their filings. It’s worth taking a look at so you don’t run into any nasty surprises.
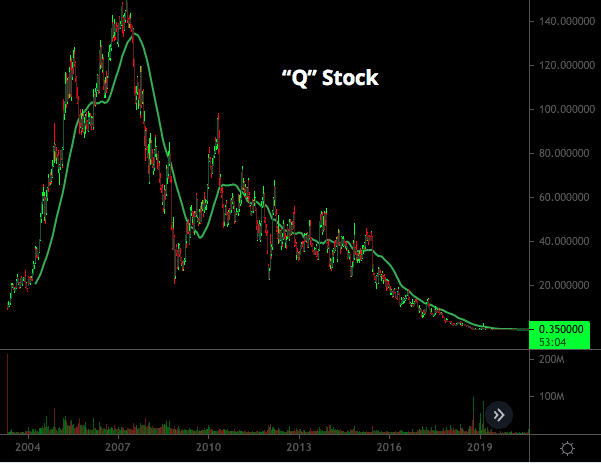
14. Be Careful with the Q’s
Most stock tickers have 1-4 letters in the ticker symbol (i.e. $T, $VZ, $AAL, and $AAPL). When a stock has a fifth letter in the ticker symbol, that letter signifies something. For example, tickers ending in “F” are foreign issues.
You should be particularly careful of OTC tickers ending in “Q.” The “Q” means that the company is involved in bankruptcy proceedings, further increasing the risk of an already risky asset class. With “Q’s,” you have the potential to lose your entire investment. Be extra cautious when trading these names, or avoid them altogether.
15. Find a Setup You Like
Every day, hundreds-to-thousands of stocks provide opportunities to make a profit. Most traders only focus on a few of them (and for good reason).
Traders do best when they stick to their niche and only focus on trade setups where they have an edge.
What is your edge as an OTC trader?
If you don’t know, you better think about it.
You should be looking for trade setups that meet the criteria of your ideal opportunity.
Do you focus on a specific sector? Do you buy breakouts? Do you buy dips? Do you look for intraday spikes or multi-day movers?
Find a setup that resonates with you and focus your efforts there. If a setup doesn’t meet your criteria, move onto the next one. You don’t need to catch every move.
The same stock may present different setups at different times. Here’s an example:
It can be helpful to create a check list of criteria that a stock needs to meet in order for you to consider a trade. This will take some of the emotions out of trading.
If you don’t know what your ideal setup is, it can help to look through your past trades to see where you made money and where you lost money. Double down on what works and scrap the rest.
16. Use a Scanner
Now that we discussed what to look for when analyzing an OTC stock, where exactly do you find potential trading candidates?
We let the data do the talking.
If you want to be tapped into the pulse of the markets, you need to use a scanner. Scanning software combs through more data than a human could possibly digest.
You can find the highest volume OTCs with the click of a button.
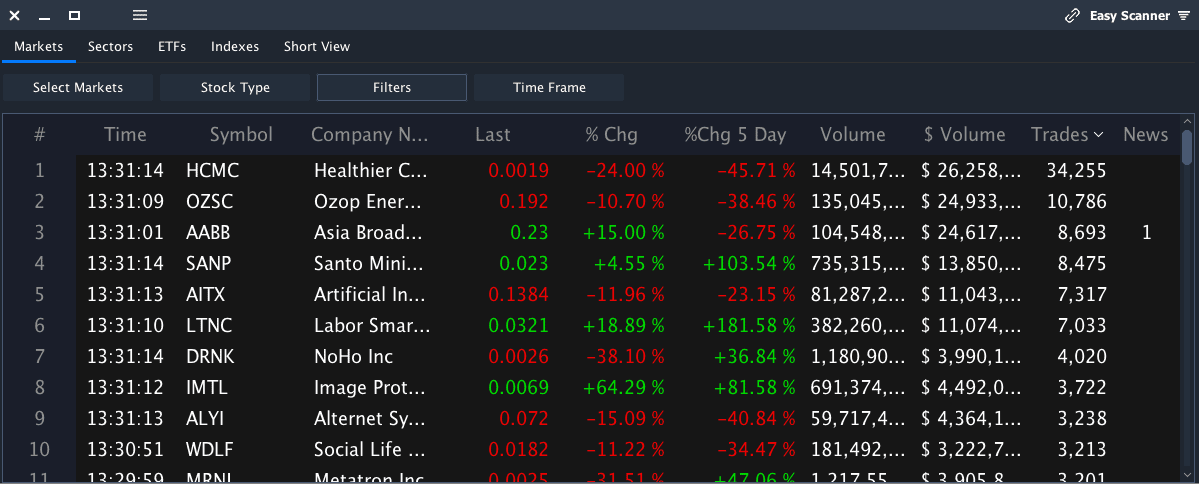
You can find the biggest gainers, decliners, and so on.
You can get intraday price alerts.
You can get news alerts.
You can even create custom scans to help you find the specific setups you are interested in (i.e. stocks setting new 10-day highs).
Without a scanner, you are trading blind. You are likely relying on message boards, social media, or online tools that use delayed data, all of which are far less reliable than a real-time scanner.
If you are serious about actively trading OTC stocks, do yourself a favor and invest in a scanner (Scanz is a great option for OTC stocks).
How to Trade OTC Stocks
Once you find some OTC stocks that you want to trade, it’s time to actually trade them. This requires a separate set of trading rules unique to OTC’s. Let’s get to it.
17. Recognize the Higher Risk/Reward Percentages
Successful trading is equal parts strategy, profit maximization, and risk management. Successful traders are not successful because they have a foolproof ability to predict future price action.
Uncertainty is mitigated with risk management. For example, a big board momentum trader may risk 1% on a trade to make 3%.
In the world of penny stocks, the stakes are higher. Penny stocks are exceptionally volatile so you may end up risking 30% to make 90% (or whatever you are comfortable with).
Here’s an example of a breakout that ended up working, however buying the breakout had an associated risk of 65% (based on the nearest support level).
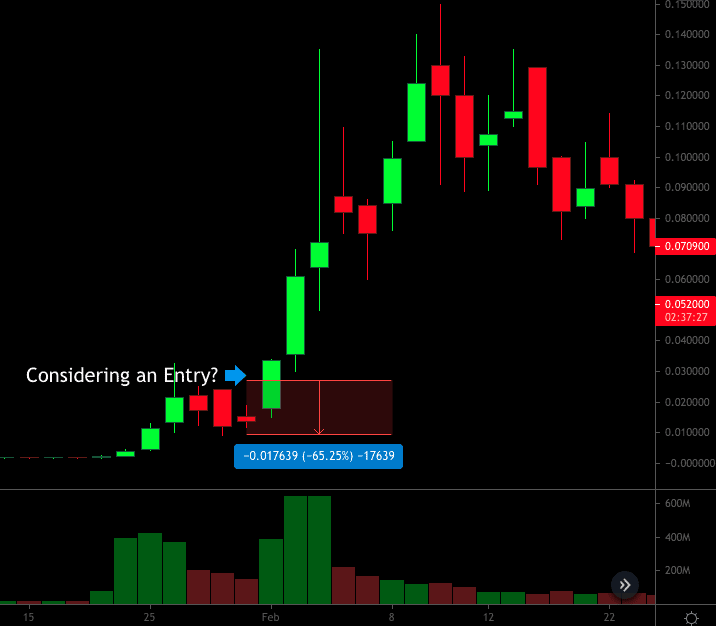
This increased risk calls for adjusted position sizing.
If your potential downside is 30%, you need to adjust your position so that a 30% loss is bearable. If you are willing to lose $300, your position value shouldn’t exceed $1,000.
18. Measure Risk Before the Trade
Risk should always be measured before you enter a position. You can’t control how a stock trades, but you can prepare in advance. This is particularly important in the high-stakes world of penny stocks.
Risk is just part of trading. We are not trying to escape that. Our goal is to take on known (measured) risk and avoid unknown risk.
The last thing you need is to wake up to a surprise 50% loss.
Determine your acceptable risk before a trade and choose a position size that accommodates your risk threshold. If you need to set hard stops to enforce your risk management plan, do it.
19. Know Your Support and Resistance Levels
Traders rely on data and risk management to make decisions. Everything we do is related to identifying price points of interest.
In order to plan your trades properly, you need to understand significant price levels where a stock may be overwhelmed by buyers (support) or sellers (resistance). These are the foundations for a strategic trade plan.
For example, if a stock breaks out at $1 and has a confirmed resistance level at $1.50, you need to have a plan for how you will react when the stock hits $1.50. Do you exit the position? Sell half? What’s your plan?
Understanding support levels helps you gauge your risk; understanding resistance levels helps you plan your exit.
If you enter a stock at $0.05/share and the nearest support level is at $0.03/share, your risk is $0.02/share. If a stock breaks out at $0.05/share and has confirmed resistance at $0.10/share, you may consider taking some profits around that area.
It’s also important to recognize that prior resistance may turn into future support and vice versa. These are key price levels that you should be aware of.
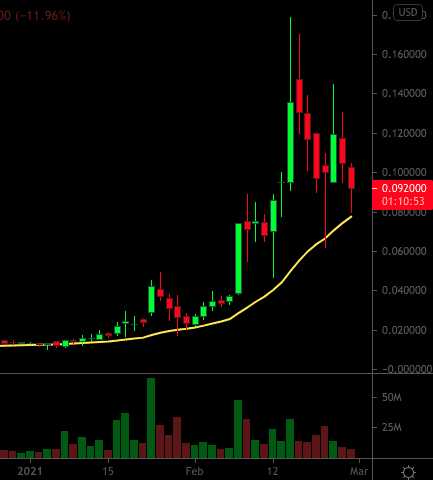
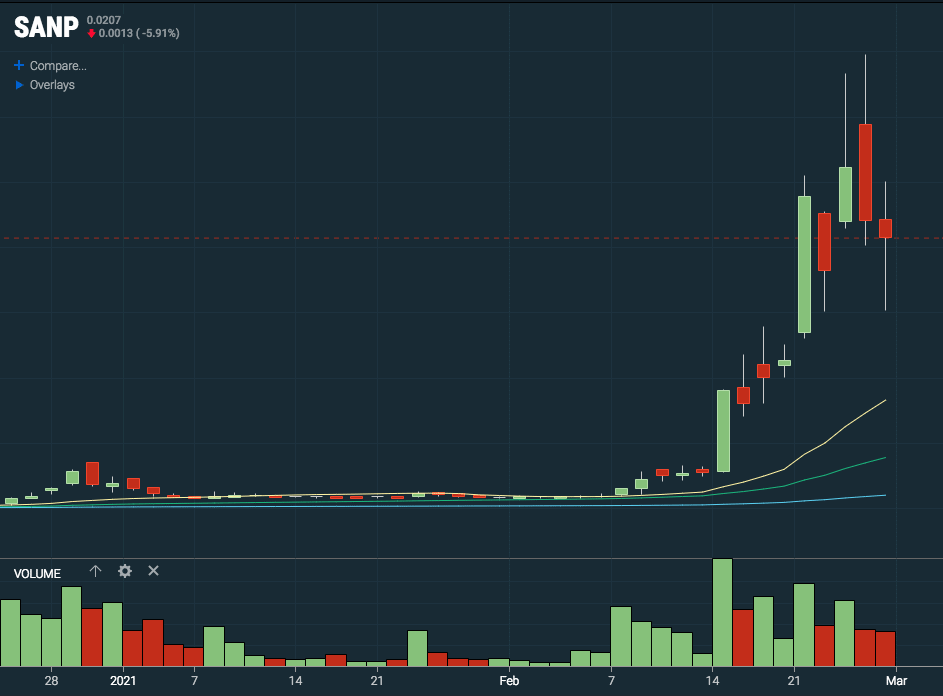
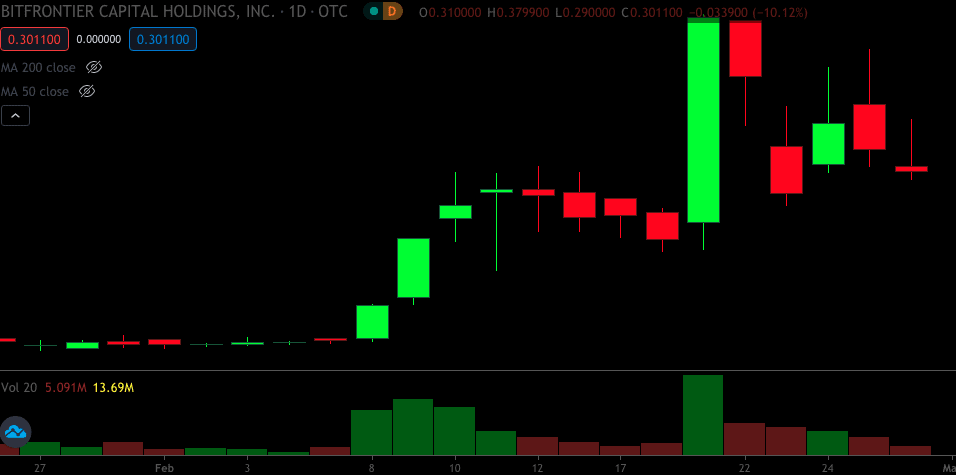
Look at the chart below.
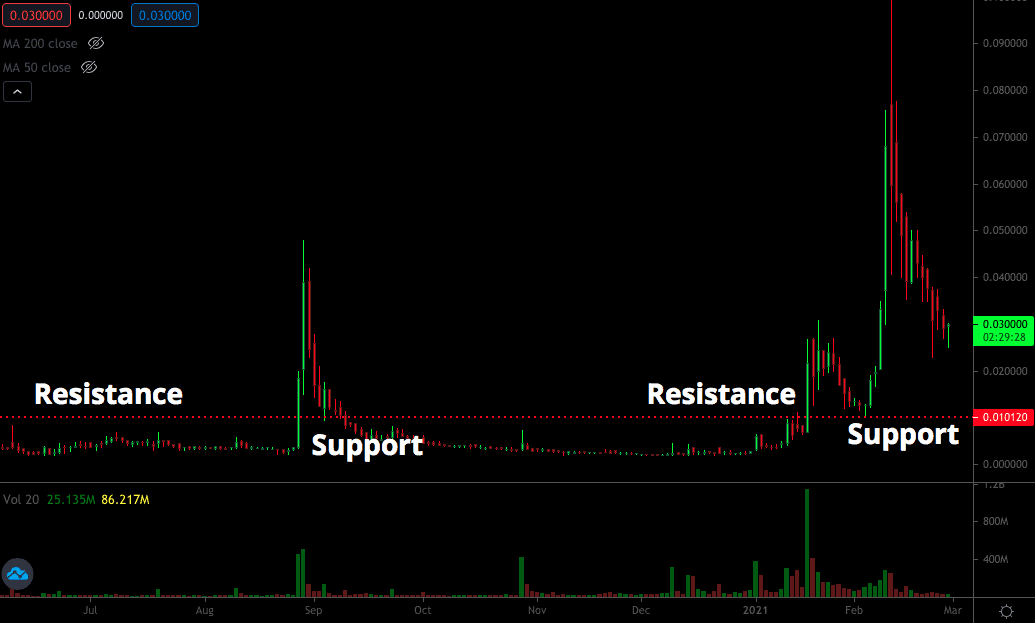
The red line is drawn right around $0.01/share. That area was resistance for awhile. When the stock broke above it, it experienced a nice breakout. When the stock started pulling back, that prior resistance acted as support for a few days before eventually caving. The stock consolidated lower for a few weeks before retesting that $0.01/ level, at which point the level became resistance. Once the stock broke out and pulled back again, the level became support once more.
It’s important to be aware of key price levels like this so you can plan your trades accordingly. Keep in mind that support/resistance levels should be thought of as price areas, not exact prices. Give the stocks some room to confirm. If support is around $0.01/share and a stock dips to $0.0098/share before rebounding, the support area held. If you panicked and sold at $0.0099, you probably didn’t give the trade enough room to work.
Plotting support and resistance is a fundamental component of effective trading. Look at charts and learn your levels before you enter a position.
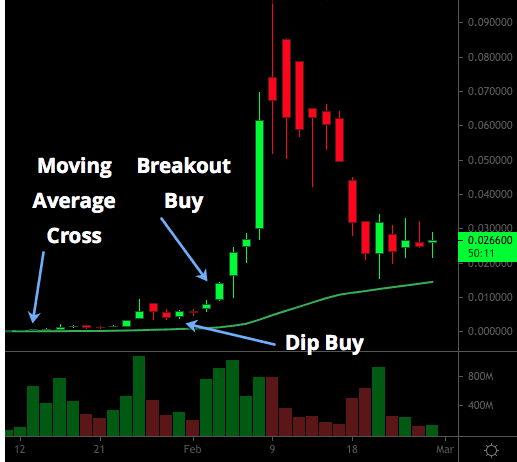
20. Use Moving Averages to Gauge Trend
As mentioned earlier, the OTC Markets are cyclical. Long-term trends are particularly relevant for these stocks.
Think about the nature of a stock that runs a few hundred percent and grinds down 90% on repeat. New bagholders are created every time.
This is part of the reason it usually takes these stocks a few years to run again. Bagholders sell into spikes or get frustrated and cut losses.
You can use moving averages to gauge where a stock is at in this cycle and where it may find support and resistance. A crossover can signal a reversal in-trend (i.e. breakout above or breakdown below).
Every trader has their own set of preferred moving averages, but some of the most popular ones are the 20-day simple moving average, the 50-day simple moving average, and the 200-day simple moving average.
The 20-day reflects the short-term trend, the 50-day represents the mid-term trend, and the 200-day represents the longer-term trend. These moving averages serve as key levels of support and resistance.
Let’s look at a few examples to illustrate the point.
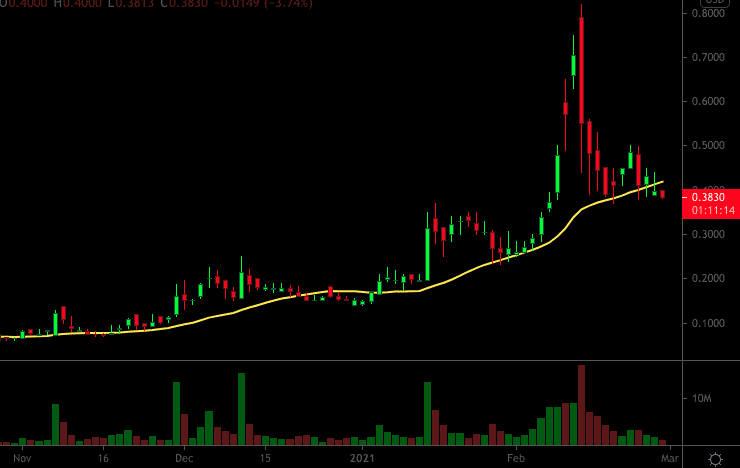
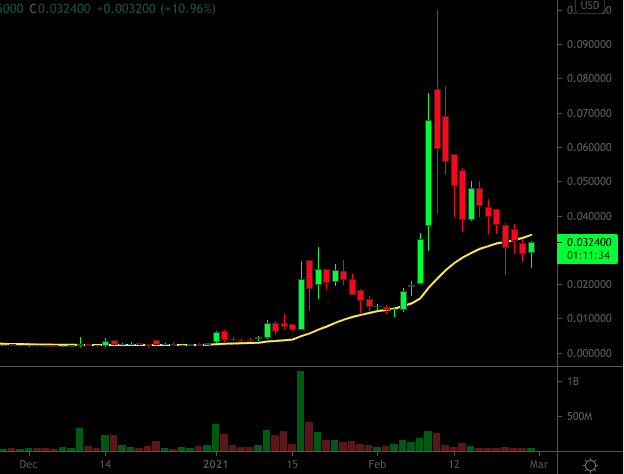
The 20-day moving average can serve as a great indicator of where a stock may find support on a pullback. When crossed, it may also indicate a potential reversal of trend. Here are some charts to illustrate the point (the 20-day is the yellow line):
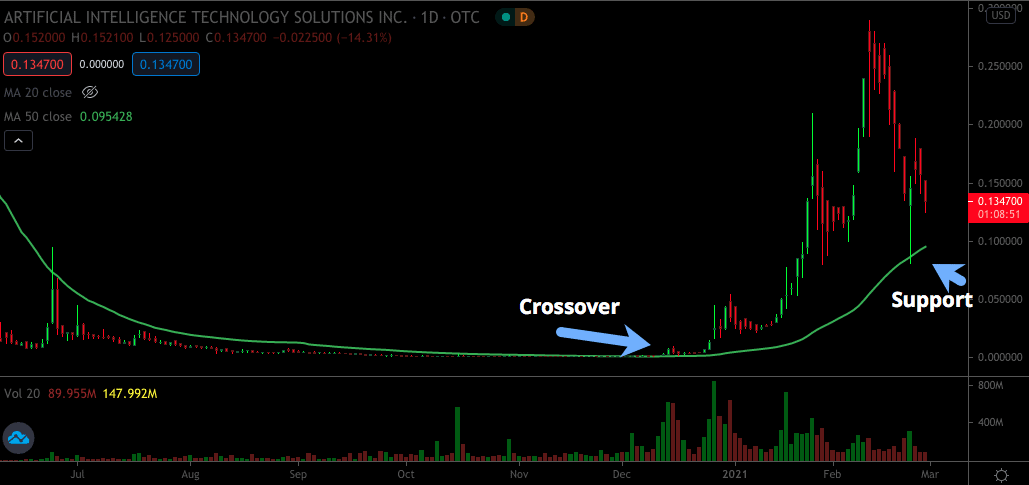
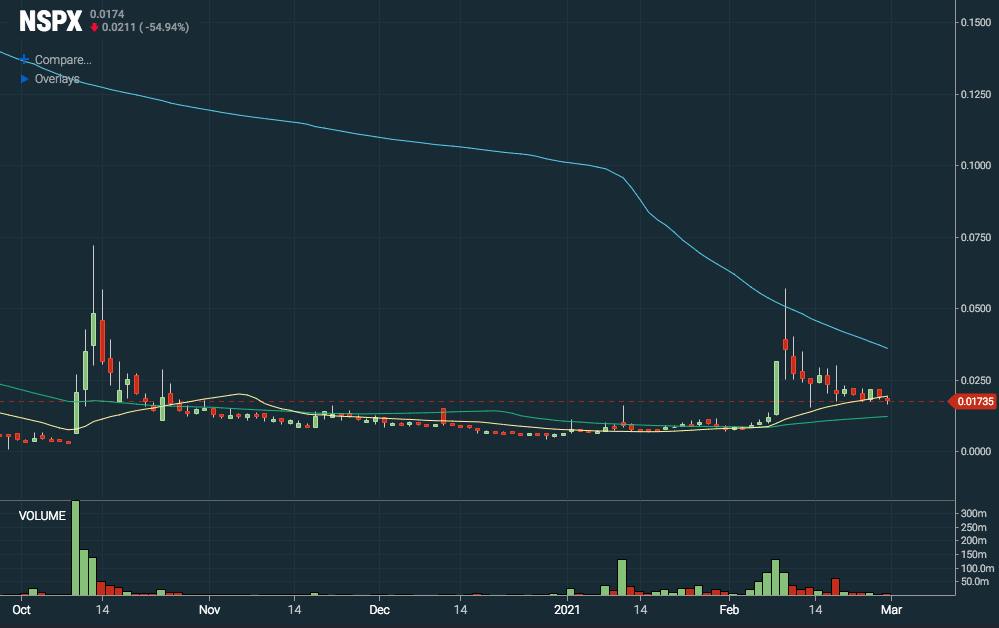
Same logic applies to the 50-day. A crossover on the 50-day after years of trading below it may indicate a potential reversal or breakout.
It’s also important to pay attention to moving average positions relative to each other. In a strong setup, the 20-day is above the 50-day and the 50-day is above the 200-day (as shown in the examples below).
In these situations, the stock is trading above all of its key moving average resistance levels, making it easier to run.
Here’s what may happen when a longer-term moving average is stacked above a shorter-term average (blue line is the 200-day):
And again…
Like anything related to trading and technical analysis, these aren’t golden rules, but they are good guidelines to follow. Pull up some charts and see for yourself.
Here are some basic guidelines that may help with moving average analysis:
- Expect key moving averages to act as support/resistance (i.e. 20, 50, and 200-day)
- Moving average crossover may signify a change in trend (i.e. breakout)
- Look for stacked moving averages where the shorter term averages are above the longer-term averages
- Give moving averages time to smooth out and converge (this represents the process of working out bagholders and preparing the chart to breakout again).
21. Don’t Chase
In the world of penny stocks, FOMO kicks in quickly. You see a stock spike 50% in a few minutes and you start salivating for a piece of the action.
Reason goes out the window and you start hitting the ask just to make sure you get filled.
….and then 5 minutes later the stock comes right back to where it started and you are down 20%+.
Here’s an example where news hit, the stock doubled, and then pulled back about 40%:
Don’t get stuck in a position like this.
Recognize the “chasing” mentality and curb it.
This doesn’t mean you can’t buy into spikes, breakouts, or rapid price advances. It means you should take a calculated approach as you would in any trade.
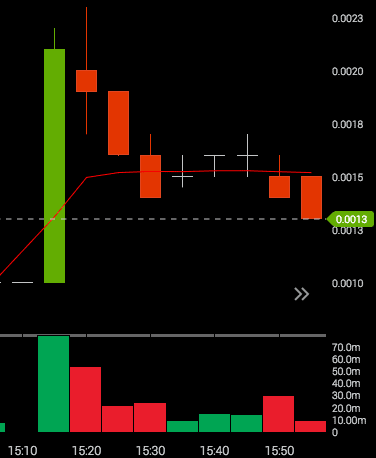
22. Buy on the Bid to Force Patience
One of the best ways to force patience is to let the trade come to you.
Instead of pounding away at the ask and continuing to inch your limit order up, sit on the bid. Decide what your ideal entry is and wait.
Take the example above where the stock ran from .001 to .0023 in less than 10 minutes. It would be very easy to increase your limit from .0013 to .0015 to .0018 and so on…. And then you would’ve been burned. Instead, you could have waited on the bid at .0013 and got your order filled later in the day.
Will some trades get away from you? Of course.
But this approach forces you to be patient and methodical. The alternative approach is emotionally-fueled and reckless.
It’s better to miss a move than get stuck in a position you wish you weren’t in. Missing a move has a flat return (opportunity cost from “what if’s” doesn’t count in trading). Chasing a move that turns on you can have a negative return. Compound those returns over time and you’ll find that the former is more favorable.
23. Pay Attention to Level 2
Stock charts illustrate historical supply and demand; level 2 shows real-time supply and demand.
A level 2 window shows open buy orders on the “bid” side and sell orders on the “ask” side. Analyzing these orders gives you an advantage. These orders reflect supply and demand, and supply and demand controls the market.
While it may be hard to analyze the supply and demand levels of a rapidly changing order book on a stock like Apple, it’s a lot easier to analyze these levels on a lower volume OTC stock.
For example, take a look at this Level 2 window and see if you can extract any insights:
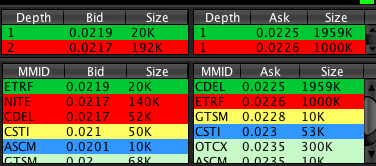
Notice anything?
There are roughly 3 million shares stacked on the ask and only a couple hundred thousand on the bid. This doesn’t mean the stock is doomed to fail, but it does mean that sellers overpower buyers at the current moment.
Questions you may consider are:
- Are more orders stacked on the bid or the ask?
- Is someone trying to unload shares at a certain price level?
- Are block trades going off?
- Is a certain market maker selling endless shares at a certain price?
Level 2 windows can often provide insights that a chart cannot. For example, if a stock is up 20% on 10 million shares of volume and you see 5 million shares stacked on the ask a few ticks away, it’s reasonable to assume that this area may act as resistance. If the stock plows through the stacked ask, you may recognize that buyers are ravenous for shares and the breakout is stronger than anticipated.
Of course, games can be played and level 2 screens can be manipulated, but you should still pay attention to what is going on.
There are no golden rules for level 2 analysis and every stock will trade differently. Get in the habit of analyzing how a stock trades and drawing meaningful insights.
24. Understand Correlated Factors
Although it may feel like you are trading in a silo, you are not.
The markets are interconnected and you need to be aware of the correlations that impact the stocks you trade.
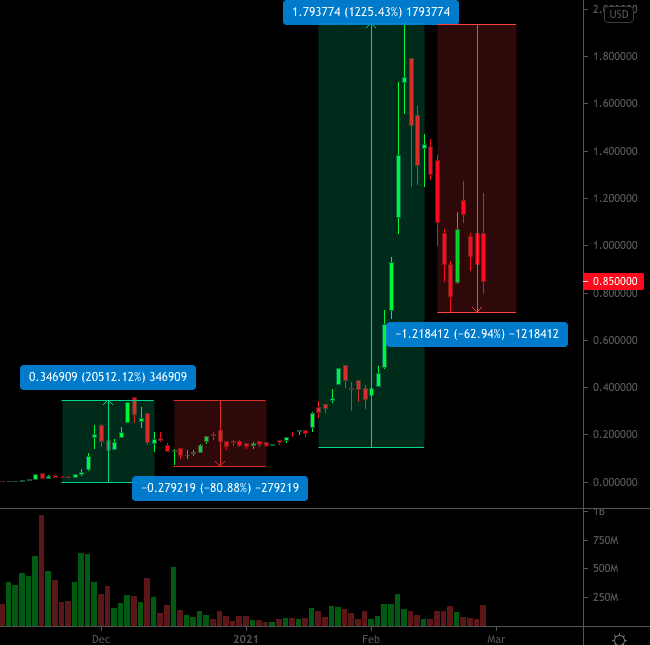
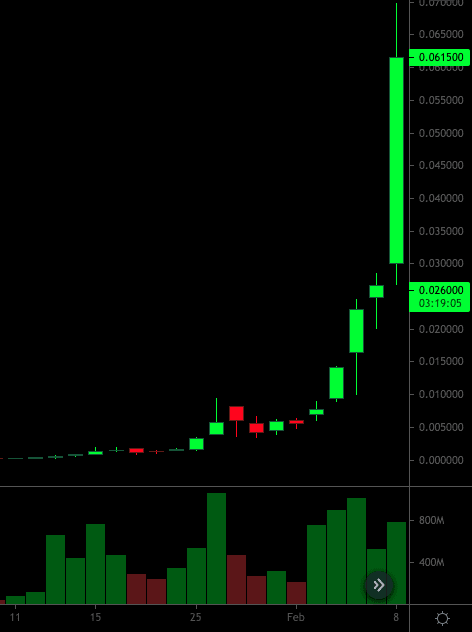
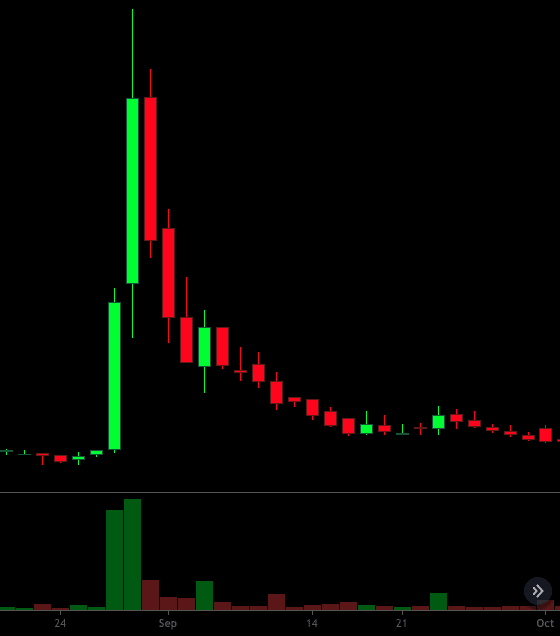
For example, many crypto stocks followed the price action of Bitcoin. When Bitcoin spiked, these stocks spiked. When Bitcoin dipped, these stocks dipped.
Here is the Bitcoin chart in February:
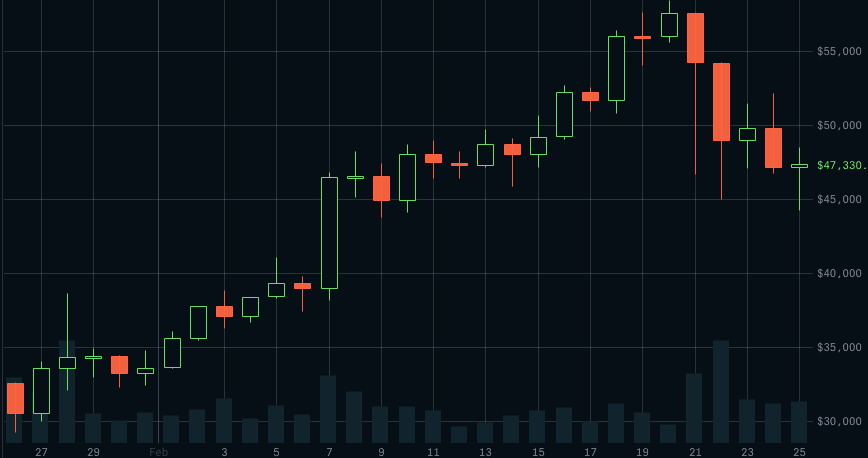
And here are some OTC charts from that same period:
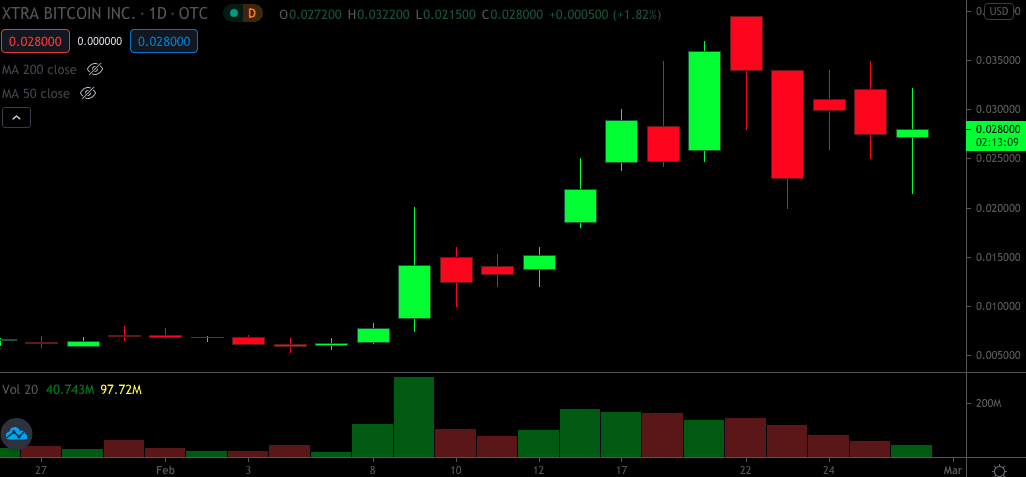
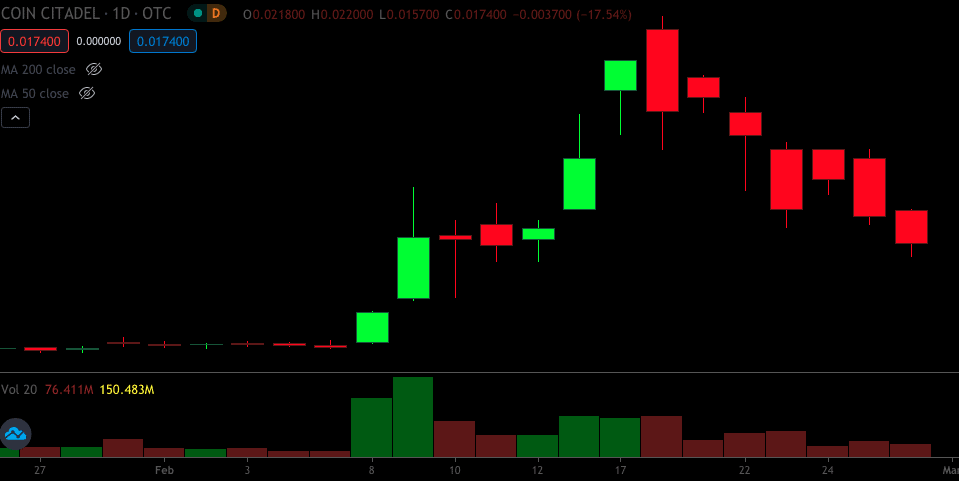
Notice the correlation?
Similarly, many stocks within a sector will move relative to each other. When the leading MJ stocks are hot, all of the MJ stocks are hot. When the leading MJ stocks pull back, all of the MJ stocks pull back.
This is the same reason many traders follow the SPY (S&P 500 ETF) when trading small caps and large caps. Most stocks follow the market and will be bullish when the SPY is bullish and bearish when the SPY is bearish.
25. Scale in and Out of Positions
Trading decisions often feel binary, but they are not. Many traders ask the questions “should I buy here?” and “should I sell here?”
There should be another component to this analysis, and that is the amount of shares you buy and sell.
Traders do not need to go “all in” and “all out” on positions. You can buy half, sell half, buy a quarter, sell a quarter, etc.
See a trading setup you like but are only 80% confident in? Buy half your normal position size.
Not sure whether or not to sell after a stock rips 100% in a day? Sell half.
Scaling allows you to match your position size to your confidence in a move.
For example, if you were 100% confident (and correct in your prediction) that a stock that just ran 100% will run another 100% tomorrow, you have no reason to sell. Of course, 100% confidence doesn’t exist in trading, and that stock could just as likely drop 50% the next day. How do you maximize profits while still mitigating risk? You lock in profits along the way. You can always add more shares later if needed.
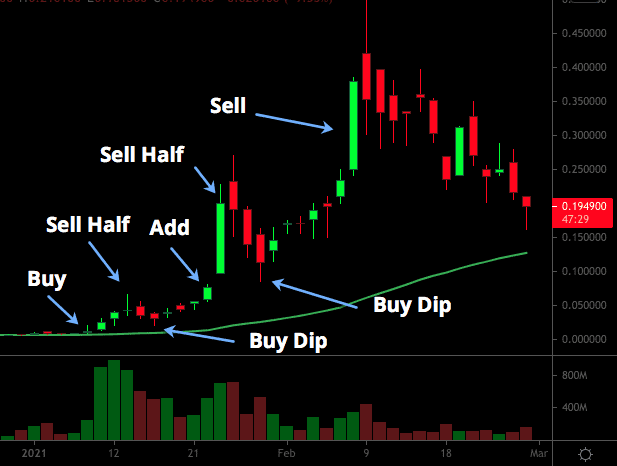
26. Buy Dips, Sell Rips
In trading, your level of foresight directly correlates with the amount of money you are able to make. Take a non-penny stock to illustrate the concept. If you invested in Tesla 5 years ago, you made a lot more money than if you invested in Tesla a month ago.
Of course, it’s not easy to make long-term predictions. There is a trade off between confidence in a move and profit potential. The only way to be 100% confident in a move is after it already happened, in which case there is no money to be made.
Anticipating a move can help you minimize risk and maximize profit potential (in certain cases).
For our purposes, we are referring to breakouts.
If you buy into a breakout, you run the risk of buying the top or entering a position in a soon-to-be failed breakout.
If you anticipate breakouts, you can buy at a lower price with lower risk and start selling when the stock rips.
Buy dips, sell rips.
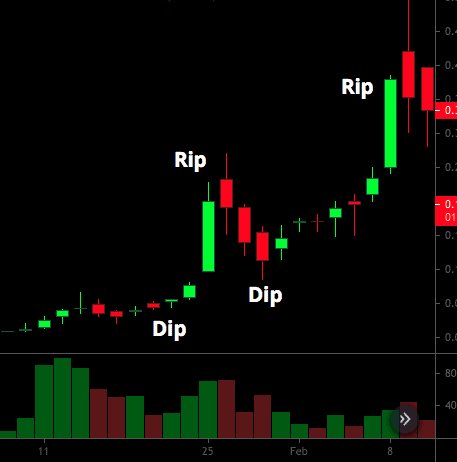
This is a risk mitigation strategy. In the chart above, the stock dips and rips multiple times, but that’s not always the case. Sometimes, the rip you buy may be the last rip and you just became a bagholder.
This isn’t to say you should never buy a breakout, but stocks generally pull back a bit after an exceptionally volatile upward move. FOMO traders buy the top, methodical traders buy the dips.
27. Remember Stocks Don’t Go Straight Up
The theme of 2020 and 2021 seems to be that stocks (pronounced “stonks”) only go up in price.
When stocks start to pull back a bit, investors are baffled. “Must be the corrupt fat cats on wall street trying to stick their grimy hands into my pockets….”
It should go without say but we’ll cover it anyway – stocks move in both directions.
Stocks do not go straight up forever. If a stock moves up a few hundred percent in a few days, it should come as no surprise that it may pull back 10%, 20%, or 30% in one of the following days.
Expect the pullbacks and plan accordingly. A pullback isn’t necessarily the end of the move. Once again, stocks move in both directions.
28. Take your Piece of the Move and Move On
Traders are always trying to balance “greed” and “patience.”
In other words, we don’t want to sell too early and we don’t want to sell too late.
Unfortunately, the perfect exit doesn’t exist. This is something you need to come to grips with.
Take your piece of the move and then move onto the next trade.
Does it sting to see the stock you sold for a 50% gain run another 1,000%? Sure…but that’s part of the game. You made money – enjoy it.
Successful traders don’t chase life-changing gains from single trades. They compound gains across multiple trades. In other words, they don’t always go for a home run – they let the singles add up. This is a tried and true method of not striking out and taking yourself out of the game.
For every chart that looks like this (multi-week breakout):
There’s another chart that looks like this (breakout and fail):
Ditch the “what-if” mentality. “What if I sell and the stock keeps going higher?” Doesn’t matter.
If you need to play the “what-if” game, make sure you account for both sides. If you are up 50%, would you be more upset if you sold and the stock doubled or if you held and turned your 50% winner into a 20% loser?
29. Diversify Your Holdings
Great traders are specialists, not diversifiers, but OTC trading is unique.
OTC stocks are too volatile (and low-quality) to put all of your eggs in one basket, especially if you are swing trading them (where most of the money is made).
If you have exposure to a single penny stock, your account will be susceptible to volatile fluctuations. The hot stocks change every week and, as discussed earlier, stocks don’t go up forever.
When the OTC Markets are hot, it can be helpful to diversify your holdings to ensure that your entire account isn’t at the mercy of a single external factor.
For example, if you have 20 crypto-related stocks in your portfolio, your account balance will plummet if Bitcoin takes a dive. Likewise, if you have 20 MJ stocks, your entire account will plummet if the sector takes a dive.
Spread your risk across different names in different sectors and avoid putting yourself in an “all-in” position.
This isn’t to say you should buy more stocks for the sake of it, but don’t focus your risk on a single stock or sector.
30. Don’t Be The Last Trader Holding the Bag
Last but not least, it’s important to recognize that OTC’s are the kings of creating bagholders. When the party is over (and the party WILL end), many traders will be left holding the bags as these stocks grind back to their realistic valuations – zero.
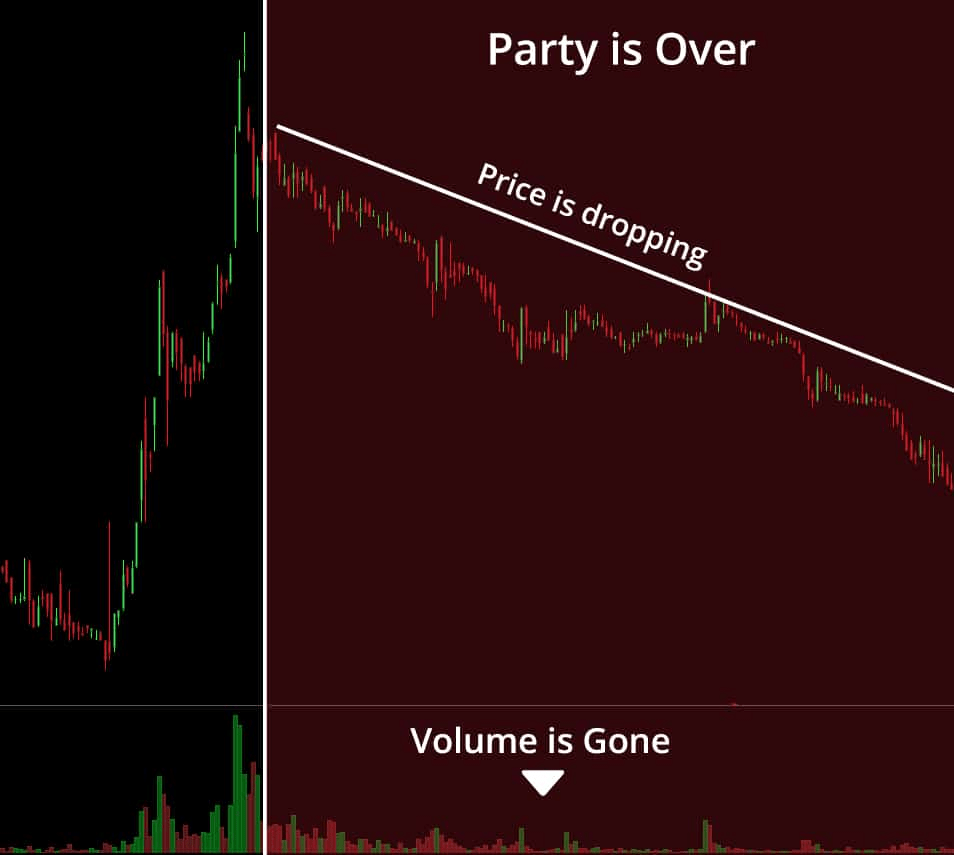
Be agile. Get in and out of positions, take profits along the way, and let the charts do the talking. Avoid averaging down, rationalizing positions, and wiping out any gains you may have achieved.
What is Your Experience?
What is your experience with trading OTC stocks? Any specific rules or strategies you utilize? Share in the comments below.


Thanks for the primer. Great trading advice and great add on to Tandem Trader
I have traded thousands of OTC penny stocks, the game changer for me was when
some of the brokers went to zero commissions this made it possible for me to set up and daily edit a lot
of limited orders so I could buy on dips at very strong support levels and sell on the bounce
back up
In less than a year I will be able to day trade, but right now I’m working a full time
job and swing trading, so it would be foolish for me to buy a stock at it’s high point in
most cases and not be there to watch it
Penny stocks move up and down very quickly, I like to start out screening for stocks using a 3 month
chart with a nice sideways movement with predictable high volume up and down movement
This is good information. Any new trailer should pay attention to this, print it out, read it every morning. Personally, I really thank you for publishing this, I’m going to read it until it sinks in. I did the same thing in the early days and lost 25,000 and I haven’t caught up yet because I still trade penny stocks. Hoping to perfect my mistakes. I know, with the right information and wisdom you can profit on penny stocks but the information above Has to be incorporated in your trades. Thank you for sending this information to me.
Great information as always. So very helpful.
Thanks for this no nonsense advice. Most of it just reinforces what I learned the hard way.
Thanks for this course and my entire pre-experience, well does acknoledge all this! Really appreciate this.
What a wealth of info. Thanks so much. Going to print this out as I’m so inconsistent. Truly impressed bro!
I received this yesterday and have read it twice!!! plus I have, I don’t know how many pages of notes to go with it and connecting it to what I know. Plus, I will re-read it, a few more times, I am sure. WOW-This is One-1 of the BEST READS-VERY IMPRESSED!!! I can’t even tell you guys, how much I really value and appreciate all and everything you do. I watch your videos weekly. One day, I will join the team. Much Luv
Many thanks to the IU community for providing great content like this and making it available to anyone.
Absolutely invaluable information in this post. Holy cow. Thank you for this. I’ll be sharing it with my close friends and family who need to hear this!
Thanks!
I just had to comment! This is one of the best articles on OTC trading I’ve ever read. You cover so much here. When I first started trading OTC’s, the challenge was finding the “USEFUL” information, that would get me in the right direction.
There is a lot of misinformation online, and whatever you do, don’t follow other traders stock alerts, or be distracted by the hype on social media. You need to be able to read the charts on your own and see the plays yourself to be successful. Stay focused on the process and do your own DD.
For me the trial and error was brutal, and cutting losses quickly was not easy to do, like I thought it would be, and I was overwhelmed by trying too many setups. Finding out what works through tracking my trades, and getting rid of what doesn’t work, helped a ton. No matter what, you have to stick to the discipline of cutting your losses quick! Keeping losses small, keeps you in the game.
This is an article that I will refer to over and over again. Any new trader who finds this article and lets it sink in deep, might just find consistency in their trading.
“Giving your son a skill is better than giving him one thousand pieces of gold.” – Chinese Proverb
Absolutely enlightening. Any trade I take I use multiple pointers; I have a tool that helps in ensuring that a stock I trade is positive in major time frames; like 1 hour, 4 hour, Day and week. When I see all these time frames are positive, it shows a strong uptrend or down trend depending on am going short or long. The software I use is called TrendTraderPro. Yes, I know Scanz, I just discovered it and am subscribing to it. Its great.