
Scanner columns can be used to show important data about the stocks that hit the scan results. You can choose to hide/display any column you’d like.
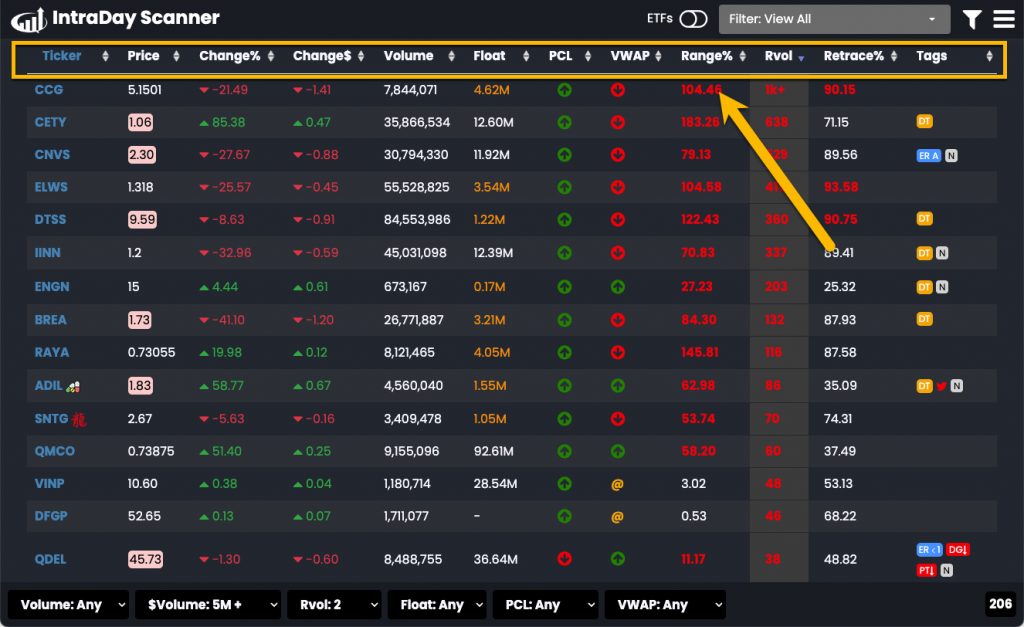
Below is an explanation of each of the columns that are available:
- Ticker – The stock sticker (May be accompanied by an icon to indicate the stock is associated with a specific theme. Hover over the icon for details.)
- Price – The current price of the stock
- Change % – The percentage move the stock has made since open
- Change $ – The dollar move the stock has made since open
- Volume – The stock’s volume for the day
- Float – The stock’s float (hover to identify the source of the float data)
- PCL – Indicates whether the stock is above or below its previous close
- VWAP – Indicates whether the stock is above or below VWAP
- Range % – The trading range of the stock for the day (based on the day’s high and low prices)
- Rvol – The relative volume for the day (i.e., today’s volume compared to the average volume over the past 30 days)
- Retrace % – The percentage move a stock would have to make to return to the day’s high
- Tags – Indicates unique features of a stock (i.e., news released, upcoming earnings report, popular on Twitter, etc. Hover over the icon for details.)
You can sort the scan results using any of the columns (click the column header). You may also create custom filters to only show stocks that meet the criteria you are interested in.