
Day trading is a game of probabilities where traders attempt to control odds by placing themselves in “low risk, high reward” situations. Of course, the market will never be 100% void of risk, but risk mitigation is still possible.
Certain situations have a higher probability of delivering the desired results. To put this in trading terms, certain trades have higher probabilities of being profitable. The “probability of success” is estimated by analyzing historical data.
For example, we may recognize that stocks in uptrends, trading above VWAP intraday, are likely to use VWAP as an area of support. This isn’t a guarantee, but it isn’t a guess either. It’s a hypothesis formulated on the basis of statistically significant historical data. The probability of this outcome (VWAP bounce) is higher than the alternative (VWAP breakdown). The key phrase is “statistically significant,” meaning there is sufficient evidence of an identifiable pattern (i.e. “A” has a high probability of leading to “B”).
Traders will inevitably increase their risk exposure when they assign too much weight to insignificant data.
Let’s make sure the concept of statistical significance is 100% clear before moving forward.
In Layman’s Terms
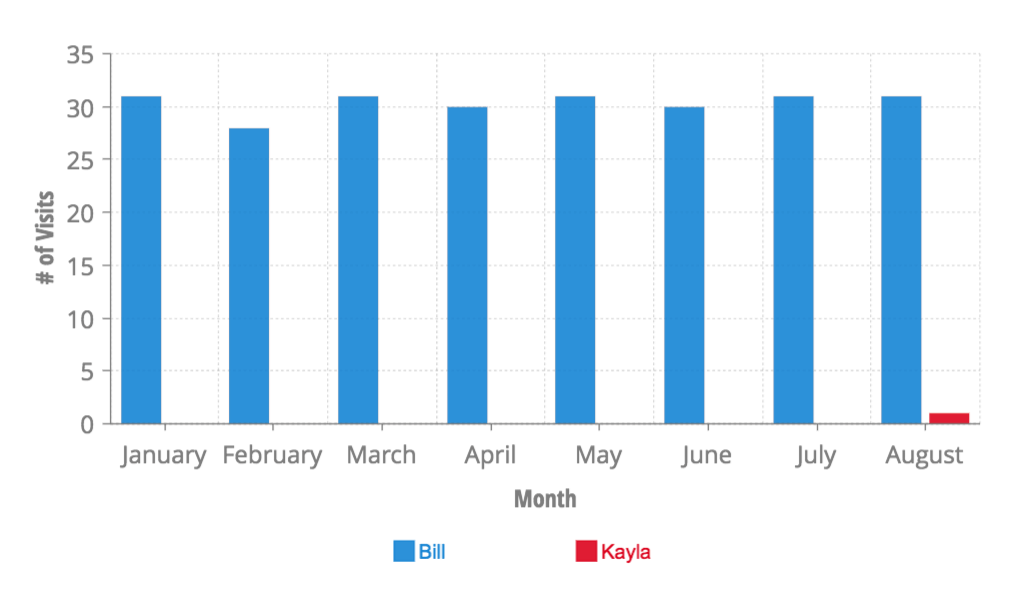
If the concept of “statistical significance” is new to you, consider the following example:
- Bill has been to Starbucks every morning for the past eight months
- Kayla went to Starbucks yesterday morning
Who is more likely to go to Starbucks tomorrow?
Clearly, the answer is Bill. We have enough data to predict Bill’s behavioral patterns, whereas we only have one reference point for Kayla.
Let’s carry this logic over to trading.
Empirical Data vs. Mere Observation
The primary job of a trader is to use data to make decisions. This process is what separates trading from gambling and gives traders the edge they need to produce nonrandom results.
Traders should be guided by empirical data that bridges the gap between isolated instances and demonstrable theory.
Analysis is only as effective as the resulting insights.
Take this weekly chart of the S&P 500 as an example:
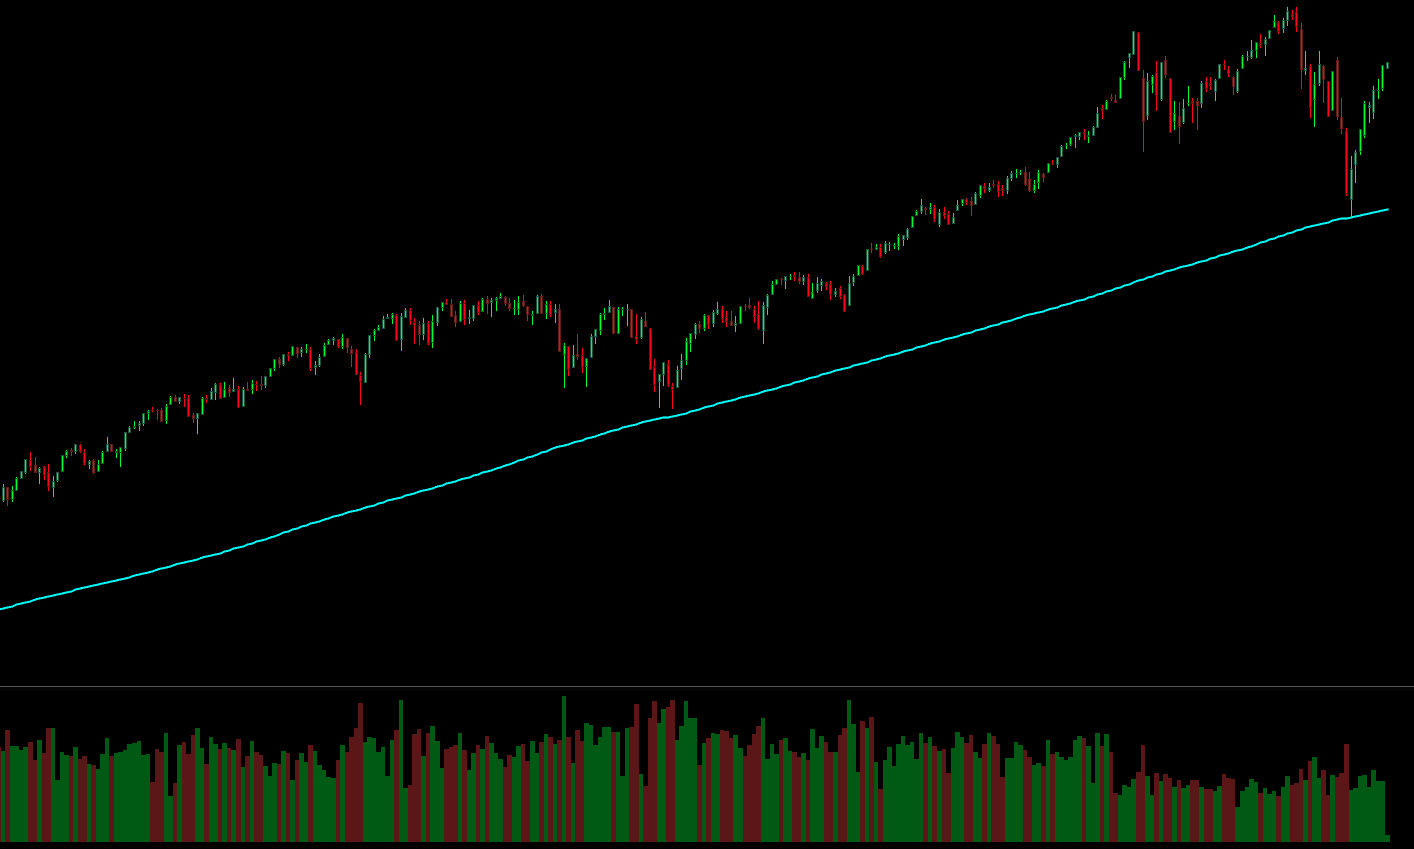
A few inferences could be made – some of them rules, and some of them mere observations.
For example, a trader could accurately infer that the 200-period moving average tends to act as support. This has been proven for the S&P 500 and plenty of individual stocks.
Contrarily, a trader could inaccurately assume that the market will always rally in January. While that observation was true in 2019, it was not the case in 2018, 2017, or 2016.
Even worse, traders may act on their gut, and place trades based on how they feel a stock should behave (i.e. “it feels like it’s time for a market rally”).
The main idea here is simple – make sure your hypotheses are backed by strong evidence.
Don’t overcomplicate the trading process by looking for patterns that don’t exist. Stick with time-tested strategies that increase the likelihood of profitability.
Keep in mind, statistically significant data does not guarantee specific outcomes, but it provides the foundation for a high-probability trade.
The “Beginners Skill” Fallacy
The lack of statistically significant data can be particularly hazardous to new traders, as this group is quick to assign meaning to the results of their first few trades.
If these initial trades are unprofitable, trading is obviously a rigged game. If these trades are profitable, the new trader is undoubtedly a trading prodigy destined for greatness.
Both assumptions are unmerited.
The truth is, the results of these first few trades are meaningless. While most new traders would prefer the profitable outcome, it’s not necessarily indicative of future performance.
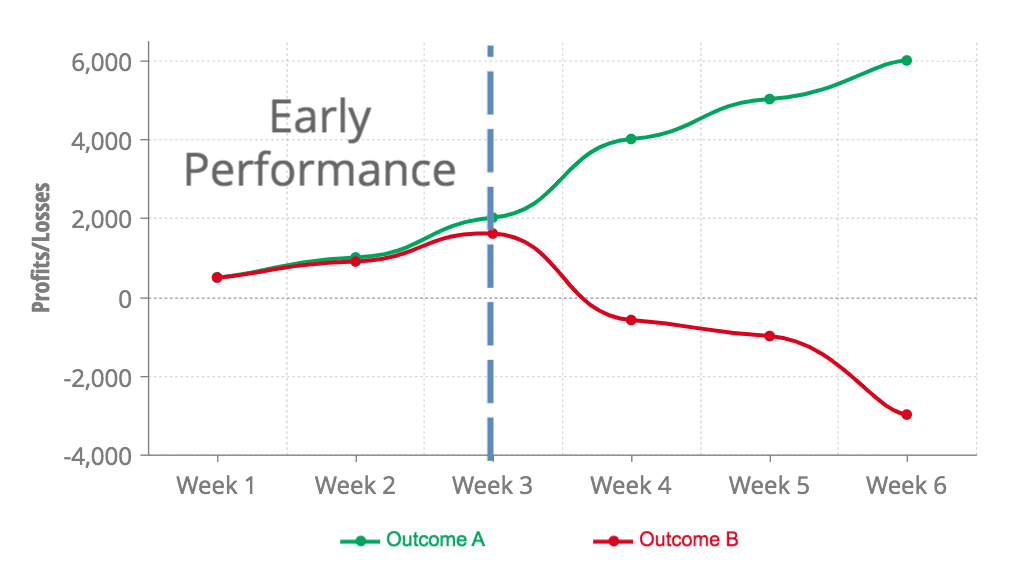
Nothing fuels an ego like early success. I see it time and time again. A new trader places his/her first trades, makes a handsome profit, and overestimates his/her skillset. “I turned my $500 account into $1,000 in a week. At this rate, I’ll be a millionaire in three months!”
This irrational expectation puts new traders in a precarious situation, as they are blind to their true risk exposure.
Experienced traders are not immune to this either. A “hot winning streak” can cause experienced traders to act recklessly until the market inevitably grounds them.
As the SEC would remind you, past performance is not indicative of future results.
Reiterating the Case for Liquidity
To summarize the lesson thus far – you should not base your trading decisions on small data sets.
The last application of this rule applies to market mechanics (and, ultimately, stock selection).
Earlier, we defined statistical significance as “sufficient evidence of an identifiable pattern.”
In the world of trading, the “statistical significance” of a move can be determined by a stock’s volume. The validity of price movement can be gauged by analyzing the volume behind the move.
For example, a stock breakout on $10 million of volume is far more compelling than a stock breakout on $10,000 of volume. The former represents major buying activity while the latter is insignificant.
Here’s an example that effectively illustrates this distinction:
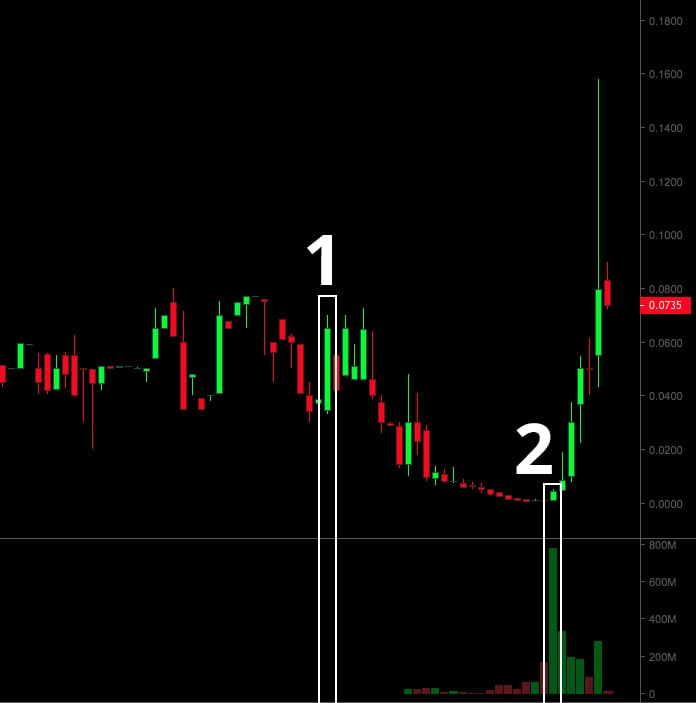
At Point 1, the stock has over 80% of range. A day trader’s dream right? Wrong. The stock has less than $50k volume, making it nearly impossible to buy/sell with ease.
At Point 2, the stock runs over 437%, this time on 4.2+ million volume, which fuels a much larger (and more tradeable) subsequent move.
Apply This to Your Trading
Always challenge your assumptions and make sure your trade hypotheses are rooted in strong empirical evidence.
You should always be able to explain why you expected a trade to pan out in a certain way, and this explanation should be based on proven high probability patterns.


I actually read all of this
It’s meant to be read.
Could you, at some point in time, post some examples of “high probability” trades? Thank you for this post.
Nate, thank you .
I found this very helphul.
What is VWAP?
Volume Weighted Average Price. Its a study/indicator you can add to your chart. Above VWAP usually bullish and below VWAP bearish; but should be used in conjunction with other things like price action and volume etc
VWAP stands for The volume weighted average price 🙂
Volume Weighted Average Price. It is a moving average that is weighted based on the number of shares purchased at each price level. Some charting software offer it as an indicator. Hope that helps.
Thank you
What’s your opinion of the Money Flow Index indicator?
Thank you Nate,
I use VWAP as an auxiliary indicator and agree with you.
Awesome, thanks!
Very informative, I hope to see more of this kinds of post .
Thanks