
As momentum traders, our goal is to follow the action. We’re not looking to trade any stock – we want to trade the stocks that have the volatility and volume we need to get in and out and make a profit.
Today, we’re going to discuss the process for finding and trading these types of stocks.
Video Lesson
Step 1: Identify an Outlier Move
Take a look at the chart below:
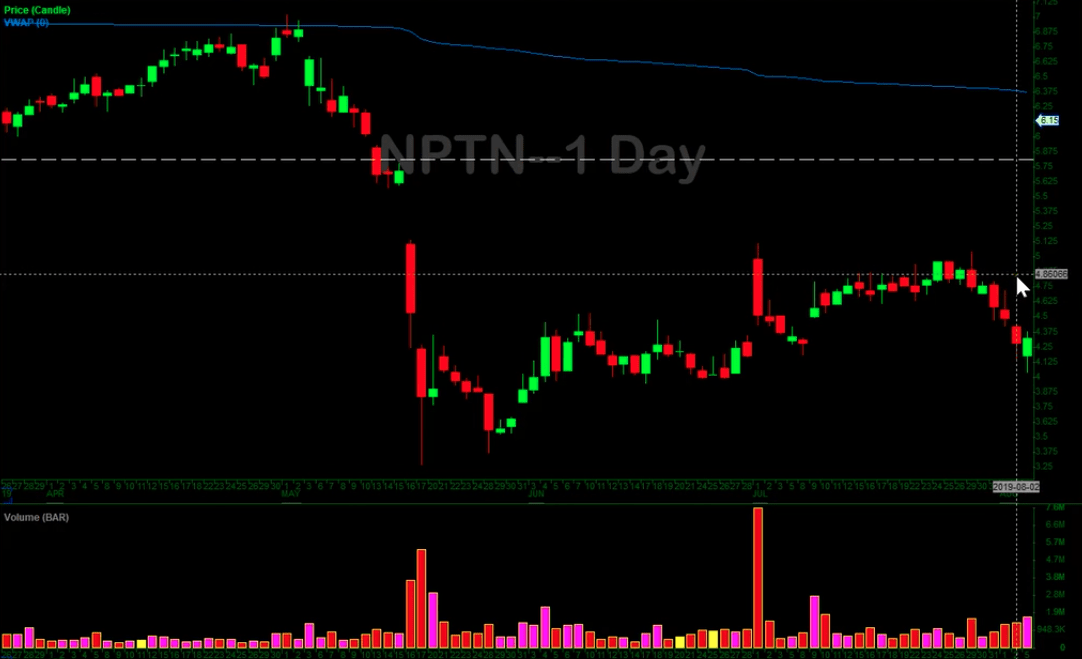
Notice anything interesting about it? Me neither…
At this point, the stock is range-bound and there is no clear setup.
Now take a look at the following chart:
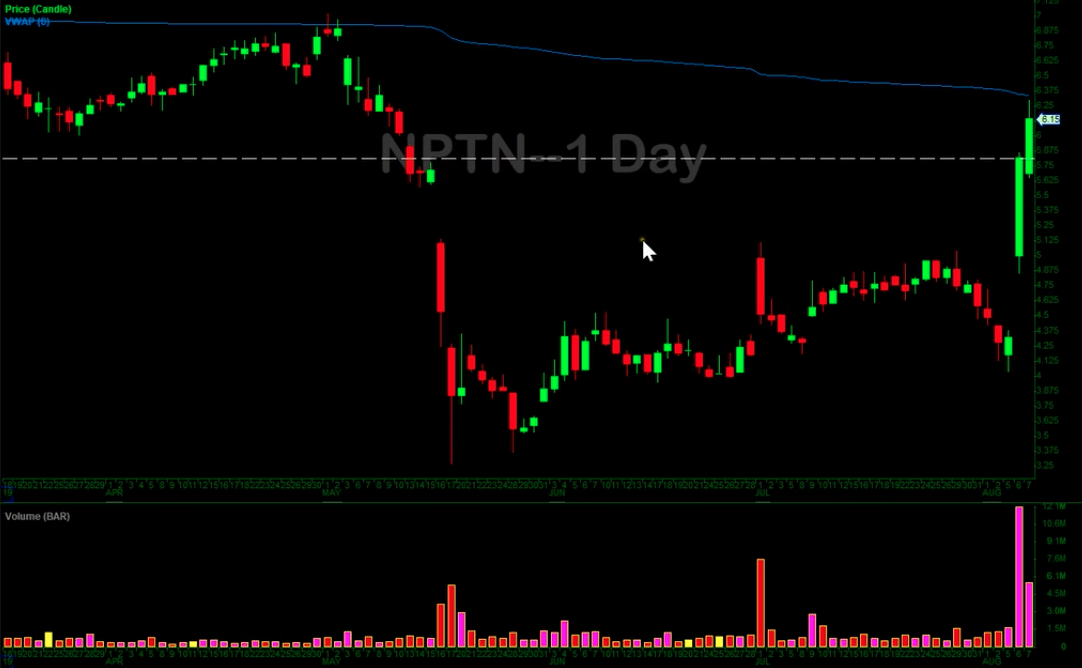
This is the same stock two days later. We can see a nice breakout fueled by volume. Now, the chart is providing an interesting setup.
The first step towards planning any trade is finding these “outlier moves.” An outlier move is a breakout or breakdown that offers a real trading opportunity.
You NEED to find these types of setups in order to have a trade. Otherwise, you can get stuck in boring stocks where you have no edge.
Step 2: Identify Key Price Areas of Interest
Once you find an outlier move, it’s time to start planning a potential trade.
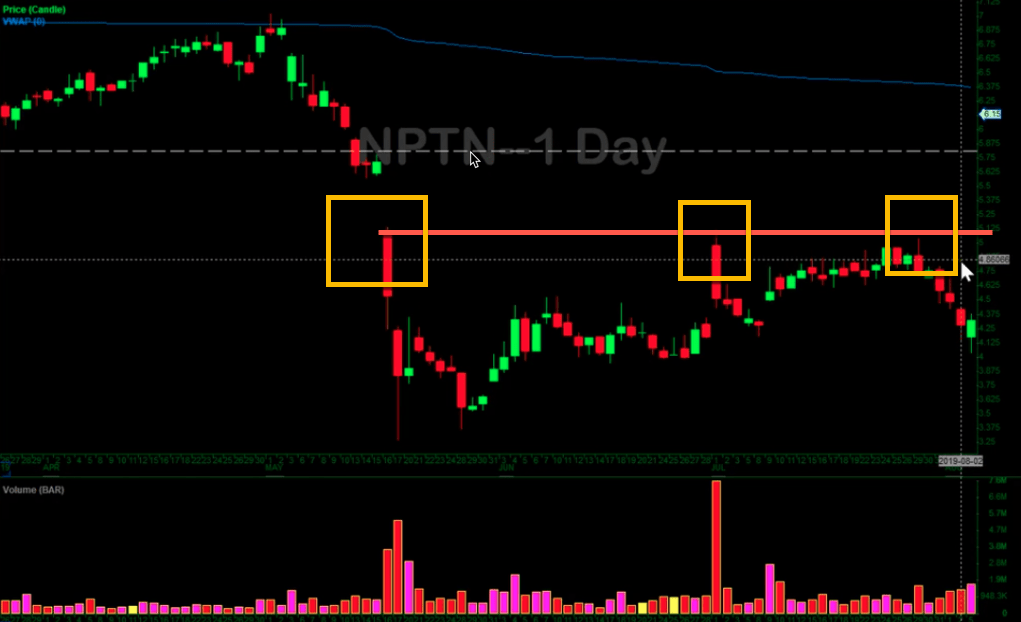
You need to identify key price areas of interest so you can better understand how the stock will behave as the price fluctuates. In order to do this, we look to the left of the chart to help us predict the right.
Basically, this means we are seeing how a stock reacted to certain price levels in the past so we can better understand how it may react to those price levels in the future.
In the case of NPTN (the chart from above), we could see that the $5.15 price level was a big area on the daily chart. The stock tested that level multiple times and failed. We want to keep an eye on that price level to see how the stock will react. If the price level is rejected, we have a false breakout. If the stock breaks above the price level and confirms the breakout, we have a trade on our hands.
Here’s a look at the intraday chart for the first day of the breakout (the first big green candle on the daily chart).
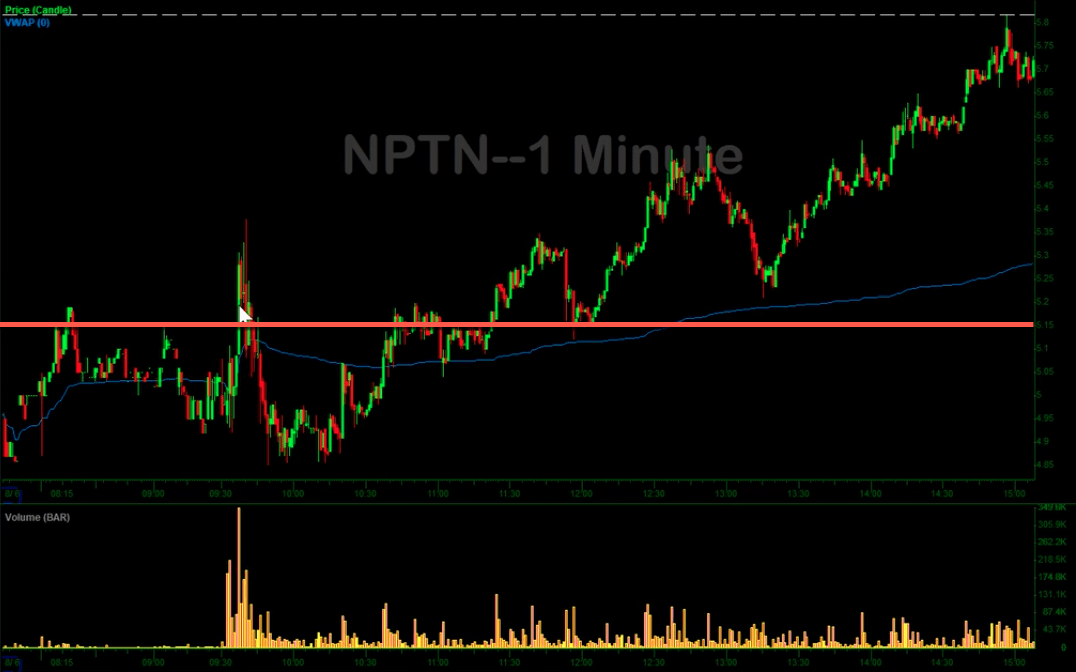
Once again, we can see that the $5.15 level is significant. The stock tests that level and fails a few times before confirming the breakout.
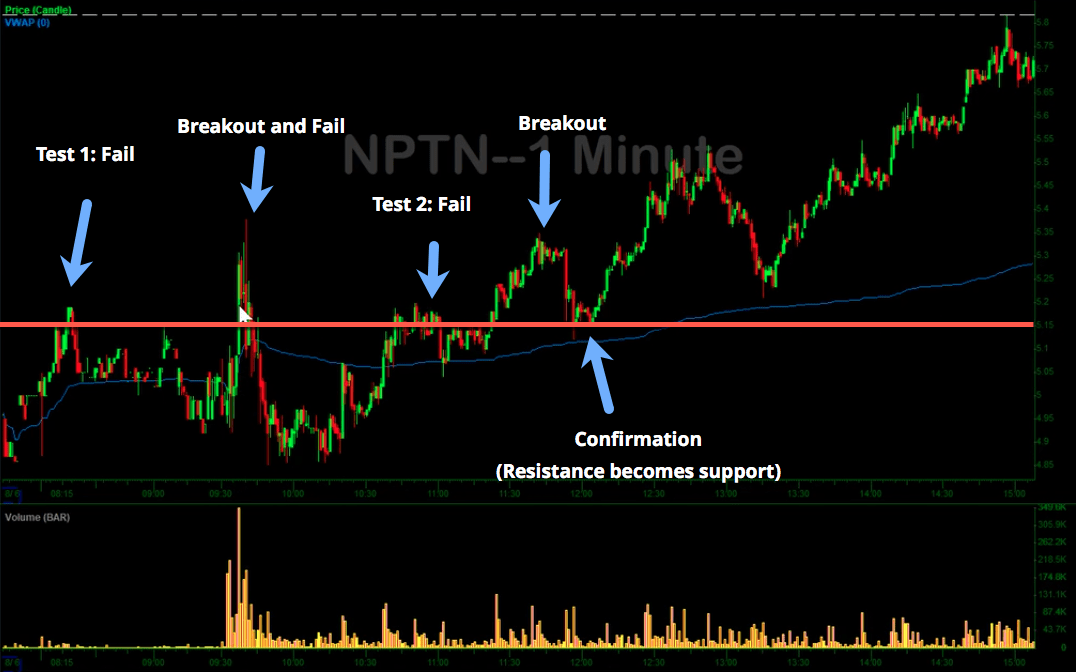
Another important thing to note (particularly for newer traders), is that these are price areas of interest. This accounts for a general range. For example, if the stock hits $5.17, that doesn’t really constitute a breakout. We see evidence of that in the premarket trading activity (indicated by “Test 1” on the chart above). The stock flirts with the $5.20 level before rejecting the breakout.
Don’t get too literal with your support/resistance levels. Many traders learn this the hard way. They may see support at $5.15 and set their stops at $5.14, only to see the stock pull back to $5.10 before continuing the breakout. Pay attention to price areas vs. exact prices.
As you continue to analyze the chart, look for multiple price areas of interest so you can know what to expect as the breakout unfolds.
Step 3: Planning the Trade
Once you know your key price levels, it’s time to plan a trade. There are a few things you should keep in mind during this process:
First, support/resistance levels are more likely to hold than break. If the stock is approaching a $5.15 resistance level, you should expect it to reject this level. That’s the very definition of resistance. If you take a full-size position at $5, you are setting yourself up for failure. This leads to the next point.
Let your conviction determine your position size. Of course, by “conviction,” I mean the likelihood that the trade will work out as anticipated (not your gut feeling). For example, if the stock is at $5 and you believe it could breakout above the $5.15 resistance level, take a starter position. You can start building a position in anticipation of a breakout, BUT if you have taken on full size by the time the stock hits $5.15, you could be in for a nasty surprise.
What exactly does this mean?
Assume your average position size is 5,000 shares. When the stock is holding above $5, you may take a starter position of 1,000 shares. When the stock breaks above $5.15, you may add another 1,000 shares. And, as the stock confirms the breakout, you may continue to add to your winning position. This is how you balance conviction and risk. We did a full post on this if you’d like to learn more.
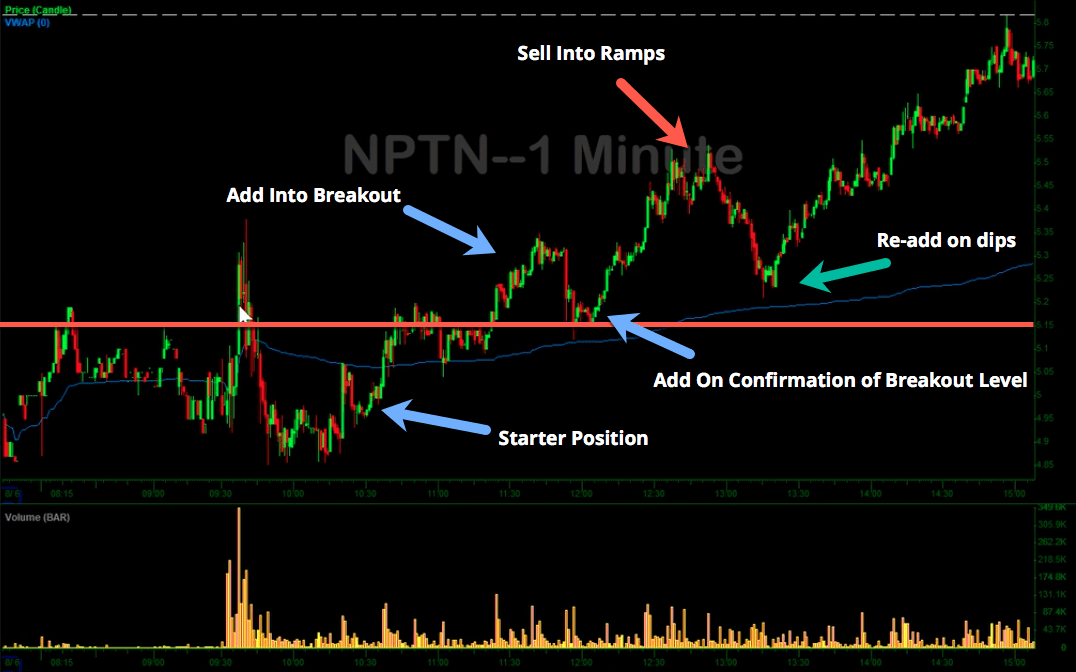
Many new traders are all in or all out. Experienced traders manage risk by matching their position sizes with the probability that the trade will pan out as planned.
Have Any Questions?
If you have any questions, leave a comment below!


Great article ! Thank you
Read it Thanks
Valuable information. Truly valuable. This information will help me become a better trader. I like the fact that that I don’t need to go all in on a position. I noticed how the price action quickly reacts to my entry. I’ll start my entry with a smaller position. Wait for confirmation that the stock will move higher, then I’ll add to my position. I also need to start analyzing the left side of the charts in order to predict the present price action. Thank you for these lessons
Thank youuuuuu. This is greaaaat.
Thank you Nate. I got caught off guard when I bought pre-market at $5.19 and got stopped us when it cracked $5. only to see it as a multi-day runner. Thank you for the lesson
Hi , what about if your a smaller account trader starting out? When you talk about scaling in your orders….on a $5 stock I cant afford to purchase 5000 shares.. I would be looking at 100-200 shares.. if I place several buy orders like that the commissions can really add up….
Very clear and concise – thank you, Nate!
Thanke for lesson.Apreciate it,indeed usufull!He a nice day!
Look LIke you wrote this article only for me…. Thanks ….. Your are best trader….
Well written… Thanks Nate makes sense why you only do mental stops.
Thanks, Nate! I love these lessons that show your thought process from start to finish. Very helpful!
Nate, imo this ticker explanation is a homerun. In-depth explanation of the trade..perfect. Would love to see other playbook examples explained with the same detail. As I said, perfect. Thank you for sharing and much appreciated. IU is the best place to be for those looking to make the commitment to succeed as a day trader.