
A day trader’s job is to effectively predict a stock’s future price action. As I’ll repeat time and time again, you can never predict price movement with 100% certainty but you can look for unique patterns that give you an edge. It can be helpful to understand both sides of a trade so you can remain unbiased in your analysis. If you only trade the long-side of a trade, you’ll always be asking the question, “is this a long?” If you play both sides of the market, you can be more objective with your analysis. This is where short selling comes in.
If you’re new to short selling, make sure to check out this post first. Short setups, like long setups, are about finding an edge. We don’t simply short stocks because they’re “up too much” or they are “overvalued.” We look for setups.
Today, we’re going to discuss one of the setups I use to identify short candidates.
Video Lesson
Start by watching this video lesson so you can see all of the chart examples and detailed analyses.
Takeaways
Here are some of the key takeaways from this video lesson.
Stocks Out of Range
First things first, our goal is to find stocks where we can come in with an edge. We need to have a reason to consider trading a stock on the short-side. One of my favorite indicators for short candidates is the range of a stock. When stocks trade outside of their normal ranges, they provide nice trading opportunities.
Here’s an example on $EOLS:
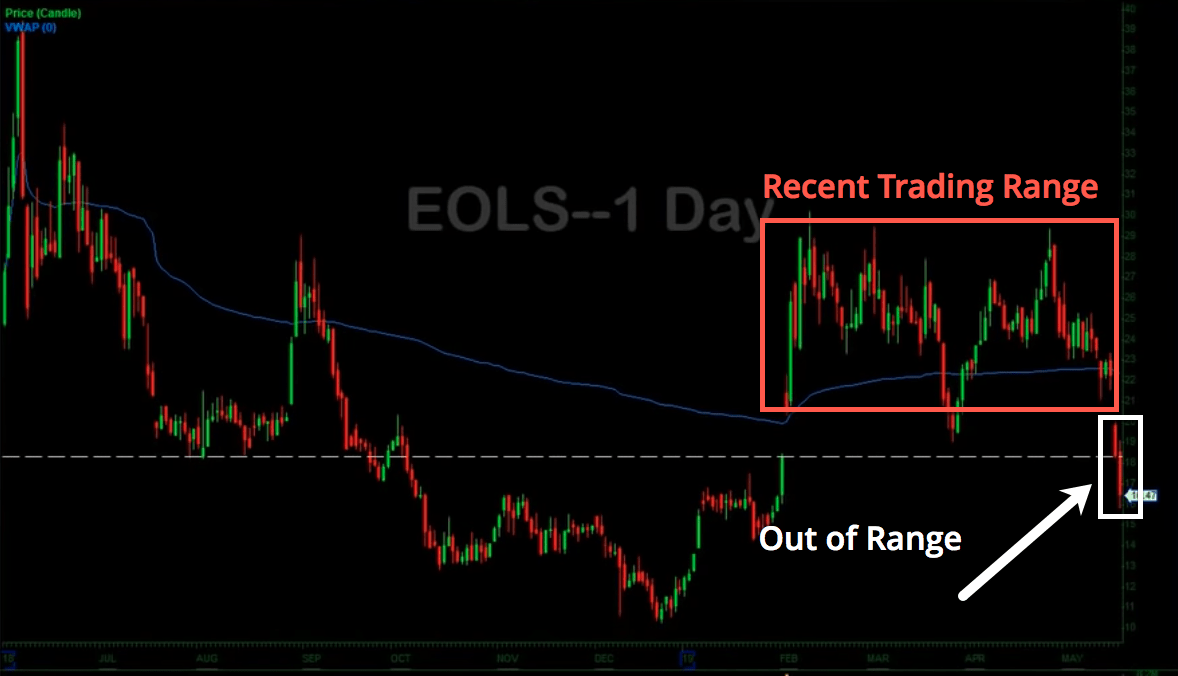
When the stock is stuck in its normal trading range, you don’t have much of an edge. Sure, there are opportunities to make money on both the long and short side, but there’s no clear setup. The stock is stuck in a range and you don’t have much of an edge when trying to predict future price movement.
Once the stock breaks out of its normal trading range, we have more of an edge. In the example above, the stock makes a move to the downside, representing a decisive shift from out of its previous range. We now know that the stock is more likely to continue moving to the downside.
Of course, this doesn’t mean that the stock is a surefire short. We need to look for other indicators.
Failed Follow Through Momentum
To understand failed follow through momentum, you need to first understand follow through momentum. Stocks don’t usually go straight up or straight down forever. They make a primary move, followed by consolidation, followed by a secondary move. If a stock is strong, it will breakout, consolidate, and continue its breakout. If a stock is weak, it may breakout, retest the breakout level, and fail (indicating failed follow through momentum.
The test of “follow through momentum” occurs at key price levels. In the case of a breakout, this test would occur at the breakout level after consolidation. In the case of a breakdown, this test would occur at the breakdown level or key support/resistance levels.
Let’s take a closer look at the $EOLS intraday chart:
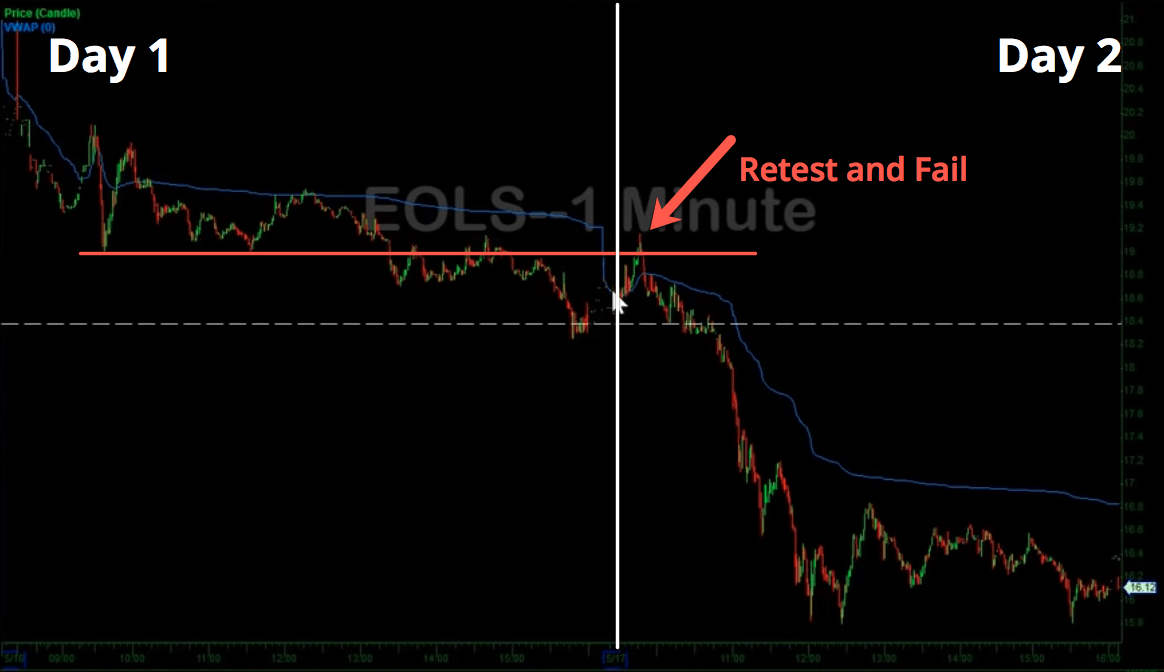
This intraday chart corresponds with the two “out of range” candles on the daily chart posted above.
The red line represents a price point of interest. On Day 1, this price level started as a support level before cracking and acting as a resistance level.
On Day 2, the stock returns to this same level in an attempt to breakout above the red resistance line. This is the “follow through momentum” test. IF the stock were to break above this level and use it as support, it may indicate a move to the upside. In this case, the stock FAILS at that level first thing in the morning before unwinding for the entire day.
This is a clear indicator for a high-probability short trade. We can initiate a short trade using that red line as our risk level (stop loss).
Heavy Stocks
When looking for short setups, we want to find stocks that have a higher probability of moving to the downside. We can do this by analyzing price action.
Remember, price action reflects market sentiment. If the market believes a stock will go up (positive sentiment), there will be strong buying activity. If the market believes a stock will go down (negative sentiment), there will be strong selling activity.
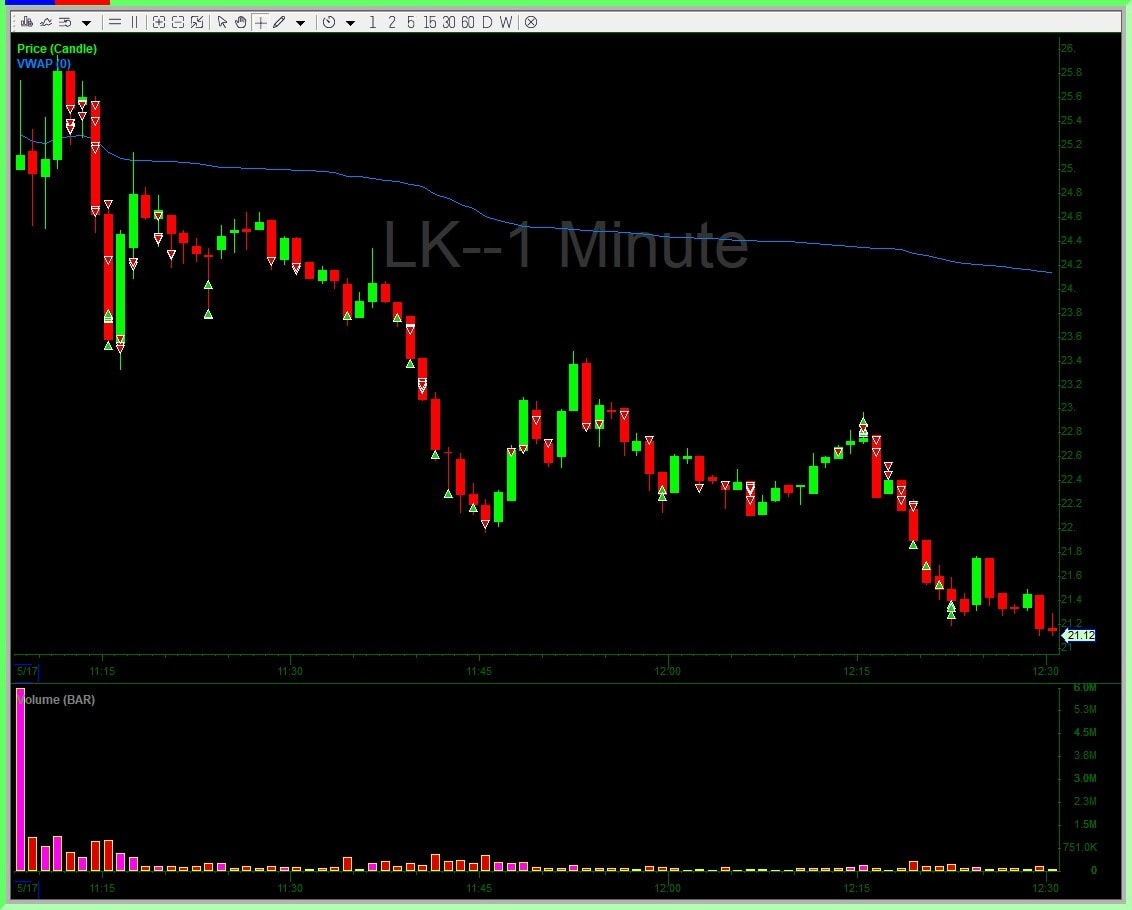
You can gauge short-term sentiment by seeing how a stock reacts to pops (intraday price runs). If every pop is followed by a strong move downward, we consider the stock to be “heavy.” Every time it moves up in price, it is greeted with an overwhelming amount of sellers ready to exit their positions.
Take this $TIGR chart as an example:
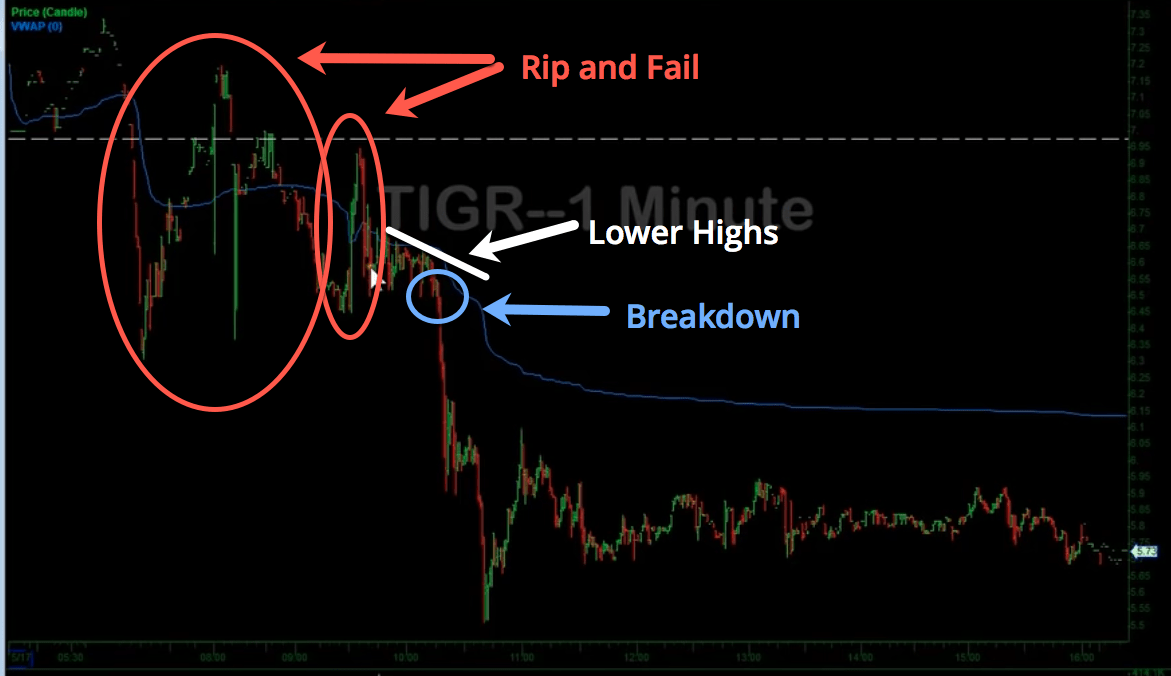
In the morning, $TIGR ramps up before it’s immediately smacked down. It continues to make lower highs at VWAP before breaking down entirely. Throughout the rest of the day, every pop is greeted with more sellers and the stock continues to pull down.
Pay Attention to the Wicks
Here’s one other trick you can use to better understand key price levels of interest (and the sentiment at those price points. Pay attention to the wicks on candlestick charts.
A wick represents the difference between the stocks low/high and it’s closing price for a given time period. This represents a strong rejection of certain price levels.
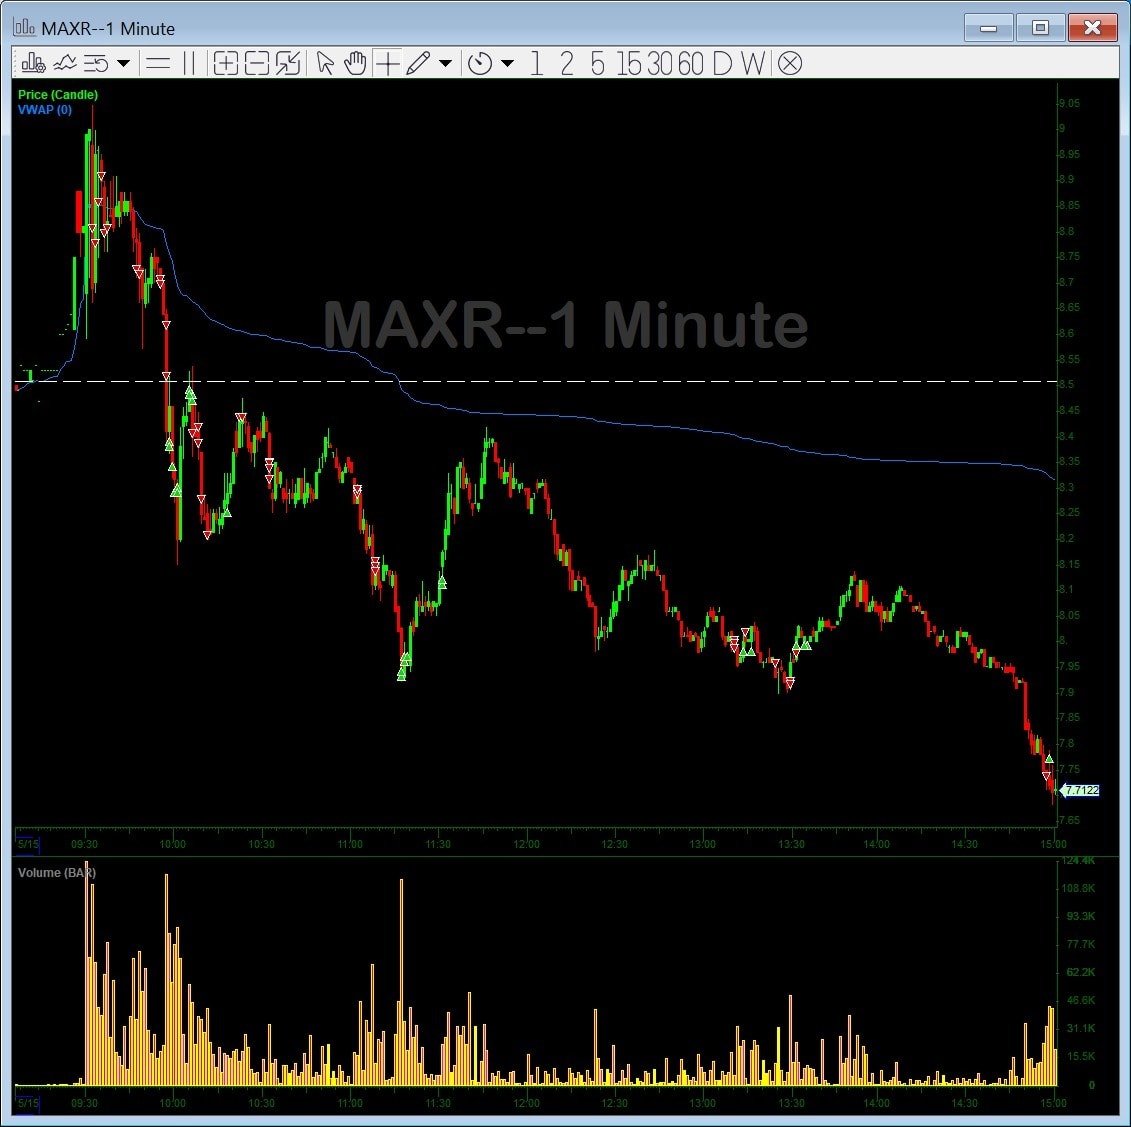
Take this $TIGR intraday chart as an example:
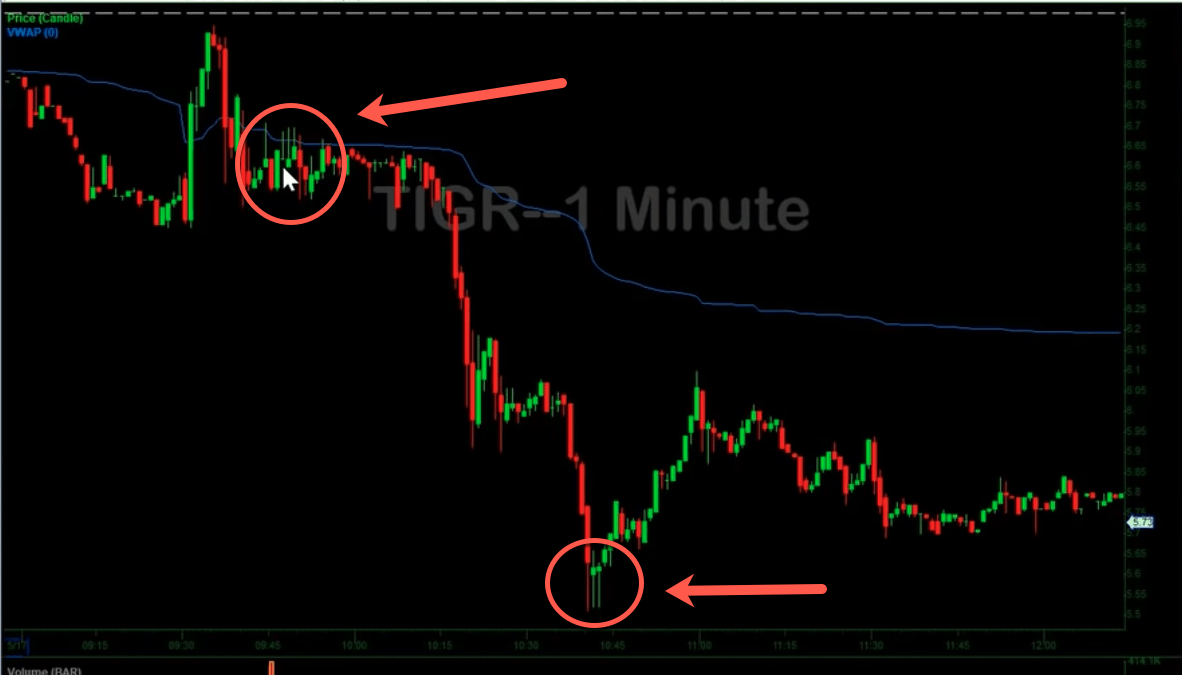
On this chart, we can see two key areas where the candlestick wicks stand out. The first is early in the morning. The stock keeps trying to break above VWAP (the blue line) but is continuously met with sellers. Each candle represents one minute of trading activity and the wicks show how fast these levels are rejected.
Later in the day, we see three big wicks at what turned out to be the low of the day. The stock strongly rejected that low three times before providing a short-term intraday reversal.
Wicks tell a story. On the short-side, they show that many traders want to exit their positions (or initiate a short) above VWAP. On the long-side (mid-day), they show that many traders want to buy shares at the point that later confirmed as the low-of-day.
Trade Examples
Here are a few recent trades placed using this strategy. The red/green arrows indicate buys and sells.
Have any Questions?
Hopefully this lesson can help you better improve your short-selling strategy. If you have any questions, leave a comment below!


Nate..
I follow your video scans off late and they are very interesting and definitely worth watching. I had a question regarding the indicators i observed on your charts. VWAP is definitely one of them and the other interesting one is linear regression..Do you use it on all stocks or only on a few names you would like to know the trend. Can you give a quick 2 min intro on how to set it because when i try to set it on my chart the channel resistance and support levels totally look different from yours for e.g the ZM chart you posted on twitter today. I tried to put the LinearRegCh100 (which is basically using the past 100 periods for calculation..tried 50 as well) and it totally looks different. What is period size you use so that I can get a similar chart as yours.
I cant stop saying this that your free video scans are worth watching and i learnt a quite few things on how professionals trade…hope one day i will be there
Thanks and have a great day…
Linear regression I just have it on my charts, never looked into it but liked it on there. I liked the lines reminds me to lock in around a core if it gets above those levels. As far as explaining what they are what they do – no idea how it’s calculated. I just used the generic settings on DAS Trader no specific changes.
Thank you Nate..
You’re welcome
Nate… You are good… Trading around the core… that was an eye opener.
Don´t stop doing these videos..
I do look forward to your emails.
Thanks IU….
PS: maybe I would change the VWAP line to white and make it a bit thicker???
Thats a stupid comment, ain´t it? Forgetaboutit.. As is is fine.
LOL
You can make your own artwork on your trading platform 🙂
One of the best videos I have watched so far, taking the time to explain your vocabulary used during the trading day over and over again is really precious. Well done, looking for more complementing very well your two DVDs
Elie – Appreciate the note!
I enjoy doing them also saves me time 🙂
excellent Nate you are the best out there
Thanks Susan for the kind words, just trying to put thoughts on videos and get ’em out there hopefully something clicks for at least one trader.
Excellent breakdown on short selling. Thank you for all of your videos.
No worries! Thanks for comment.
I have never yet to try shorting but good to learn more about it before I actually shorting it.
You explain very nicely but I still didn’t quite get it as it am new to the market.
Thank you so much! Keep up to good work! Thumbs up!
Very well done, Nate – thank you!
I find that the more experience I gain, the more I get out of your videos.
Superb presentation – thank you!
For anyone wanting to gain further understanding of “heavy, trading around a core, scaling, etc”, this lesson is excellent. Three months ago I was grasshopper. Today I am only bigger grasshopper but expanding my knowledge everyday. In it for the long term. Watch and learn today.