
Day Trading Encyclopedia
Introduction to Technical Analysis
Technical Analysis
What is Technical Analysis?
Technical analysis is the interpretation of the price action of a company’s underlying stock (or any tradable financial instrument). It utilizes various charts and statistical indicators to determine price support/resistance, range and trends. It identifies historically relevant price patterns and behaviors to help forecast potential direction of the stock. This methodology focuses only on the price of the shares, not the operations of the company.
How Does Technical Analysis Work?
By using historical price data, technical analysis attempts to interpret the supply and demand that moves share prices. Dinosaurs can’t walk in the sand without leaving footprints. The dinosaurs are the institutions, mutual and hedge funds. They are the participants that move stock prices. Technical analysis visually tracks the activity of the dinosaurs using various charts and indicators to pinpoint price areas of strong interest both in terms of buying and selling. History tends to repeat itself as evidenced by price patterns.
Who is Technical Analysis For?
Anyone who trades or invests in the stock market or any other tradable financial instrument should consider learning at least a basic level of technical analysis. It your money is invested into a position that has price movement, then technical analysis will help you make better-informed decisions as to how much risk to employ for how much potential reward.
Stocks represent the underlying company’s business and operations. However, the perception and future valuation of the company and its performance is reflected into its stock price. There is often a divergence between the two. Technical analysis also helped to determine where the divergence lies and how much opportunity may exist.
Start Day Trading With Our Trading Simulator FREE for 14 Days!
Basics of Technical Analysis
Technical Analysis can be applied to all different chart types.
Technical analysis involves and utilizes various tools and indicators. The right mix of the tools can be used to generate converging signals that improve the probability of a direction price move.
Stock Charts
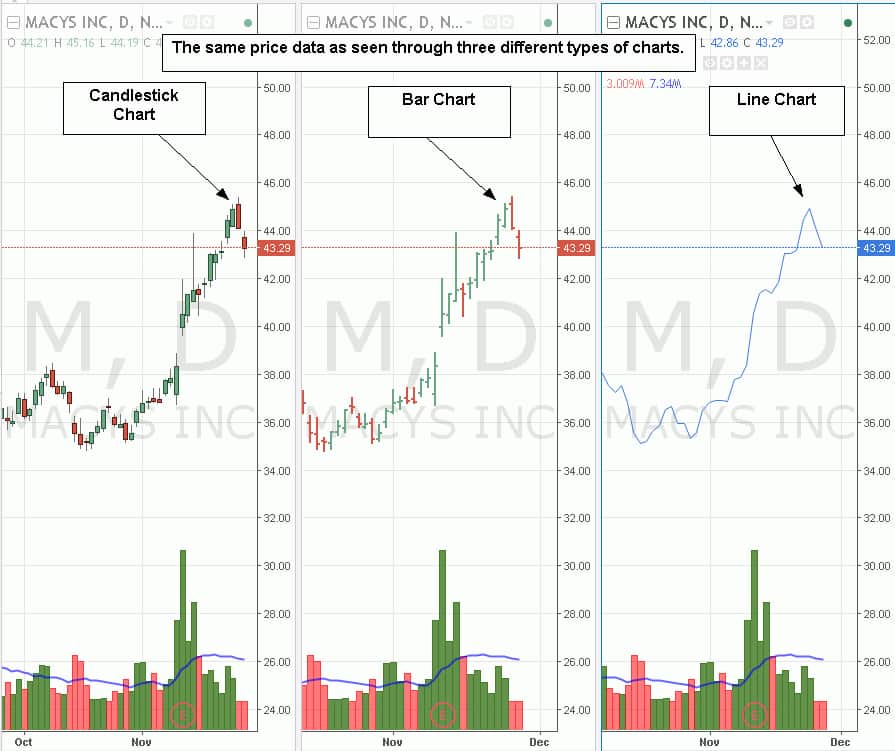
Technical analysis seeks to interpret the story of a stock’s price action. Charts act as the canvas where the story is painted. The common types of charts are candlestick, bar and line charts. Charts plot the prices where trades have been executed. The time interval of the chart can be specified through the settings. Time intervals segment the price action of the stock. For a 5-minute candlestick chart, each candle represents a five-minute segment of trading that record the starting price (open), the highest price (high), lowest price (low) and last price (close) trade during the period. As the five minute window ends, it will display a candlestick that details the four data points (open, high, low, close) and a fifth data point that encapsulates the opening and closing price (body) and colors the body red if the last trade (close) is lower than the first trade (open), or green if the last trade (close) has a higher price than the first trade (open). Bar charts include the same information without painting the body. Line charts simply connect the closing price only for each time period.
Support/Resistance
By visually marking the charts, users can see certain price levels that tend to prevent prices from falling any further before rising back up again. These are known as price support levels. Users will also spot price levels that continue to provide a ceiling, that eventually causing prices to fall back down again after testing. These are known as price resistance levels.
Stock Volume
Volume measures the total number of shares traded for a specified period of time. It is used as a measure of interest that can manifest into significant price action. High volume indicates significant trading activity that triggers a breakout or a breakdown accompanied by a sustaining trend in prices. Breakouts result in higher trending prices and breakdowns result in lower trending prices. When volume is light, stocks tend to chop around in a range known as consolidation.
Trends
Trends indicate the current direction of share prices. When stock prices continue to rise higher, it is considered to be in an uptrend and vice versa for a downtrend. Uptrends indicate increasing demand for shares, as buyers are willing to pay higher prices as supply diminishes. Downtrends represent an oversupply of shares with waning buying interest resulting in falling prices. By connecting the various high and low points on a chart, you can manually generate trendlines that pinpoint support/resistance and direction of stock prices. When compared to historical templates of similar trendlines, you may be able to forecast the future direction, turning/inflection points and targets.
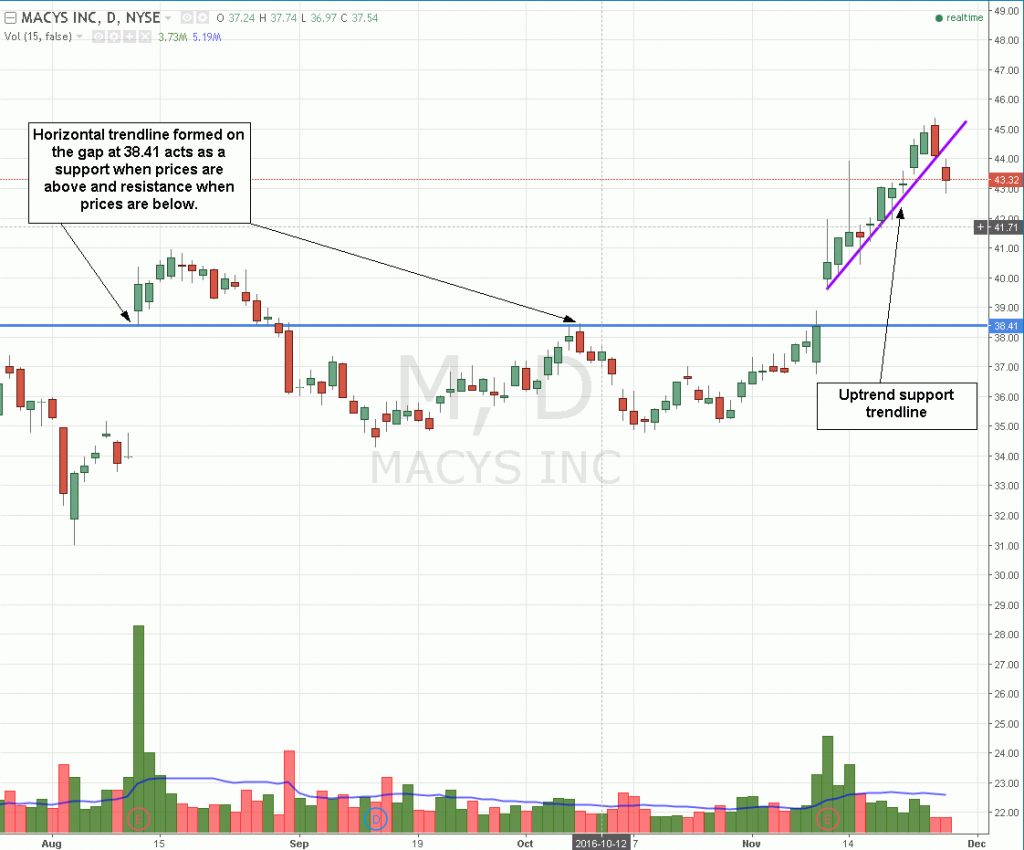
Trend lines can be used to summarize the general sentiment surrounding a stock, whether it is bullish, bearish, or neutral.
Technical Indicators
Having the data points plotted on a chart helps to eyeball the direction of stock prices, but deeper analysis requires more data crunching. What may have taken hours by hand in the old days can be processed in seconds thanks to the multitude of technical indicators on today’s charting and trading platforms. Trends can be visually tracked with indicators like moving averages, which are dynamic lines that connect each period’s closing (last) price. Charting/trading platforms enable users to manually draw in their own trendlines directly onto their charts. Different traders may have different trendlines based on the time frame of the chart as well as the starting point.
Technical indicators can be used to organize, summarize, and analyze price and volume data for improved decision making.
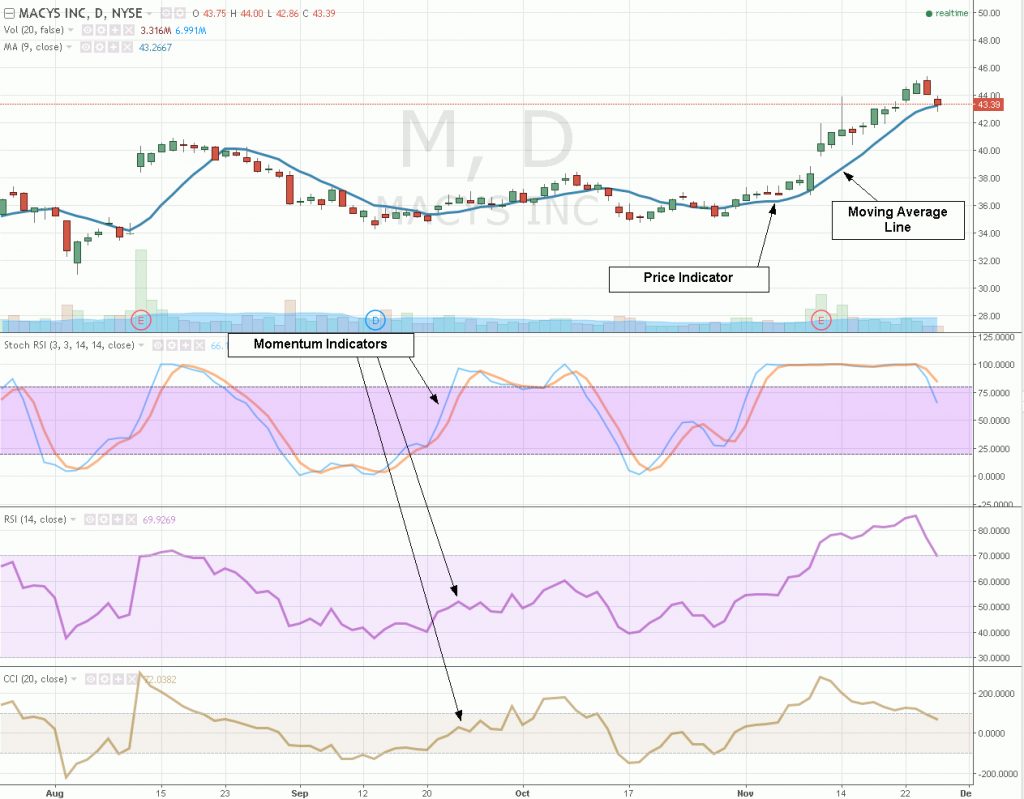
Price indicators
Indicators that output price-based information like trends, support and resistance are price indicators. They are usually displayed and tracked on the price portion of a chart, usually the upper chart. Moving averages, candlesticks/bars/lines, Ichimoku clouds, point and figure, pivot points, three line break and Renko bars are all popular price indicators. Trendlines and trend channels are either manually or automatically drawn are strong price indicators as well.
Momentum indicators
Indicators that measure the momentum of a stock including overbought and oversold conditions are momentum indicators. Basic momentum indicators come pre-programmed in most charting/trading platforms. These indicators help traders to better time their entries and exits. When properly used, traders are able to avoid chasing prices when momentum indicators show overbought conditions like a stochastics peaking and falling back under the 80-band. While price is important, understanding how the price level is achieved can be just as significant. Stochastic, Relative Strength Index (RSI) and Commodity Channel Index (CCI) are three widely used momentum indicators.
Using a combination of price and momentum indicators can help generate effective entry and exit signals. The science of successful trading utilizes the right mix of technical indicators to generate high probability set-ups and triggers married with prudent disciplined trade management. Technical indicators optimize the process of price analysis.
Introduction to Technical Analysis Video Course
For further information on technical analysis, review this segment of the Investors Underground free beginners day trading course.