Adding
Adding shares to an existing position.
Examples:
Adding INTC
Looking to add TEVA if VWAP fails
All done (Done w/)
Closing out a position.
Examples:
All done SHOP
Done w/ MARA for now
Bases/Basing
A stock is forming an intraday base (support level) after a pullback or gap down.
Examples:
SNAP based at 20
Waiting for TRIP to base before going long
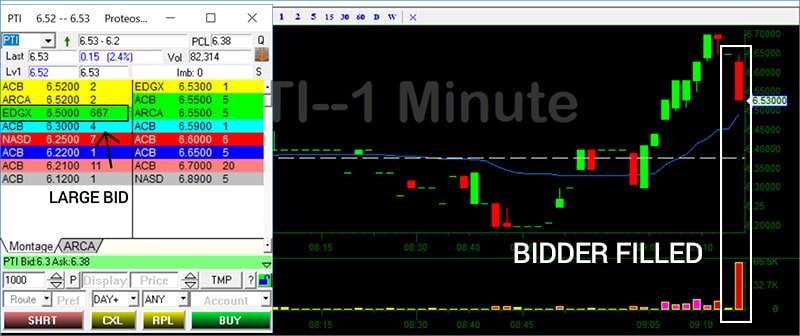
Bid/Bidder
When a stock has a relatively large order (buyer) on the bid, as shown on a level 2 screen.
Examples:
SNAP bidder
PTI bidder filled
Buying on Dips
Buying shares in anticipation of a breakout, allowing for a better price average. For example. If a stock breaks out above 5, hits 5.50, and you expect it to go to 6, you may wait for the stock to pullback to 5.30 before entering a position.
Examples:
Adding WMT on dips
Will add SNAP on dips if trend holds
Chase/Chasing
Entering a position after a stock has moved up or down quickly. For example, if a stock runs 10% in 3 minutes without pulling back, going long may be considered chasing.
Examples:
Avoid chasing RIOT
Added small TRIP – chase entry
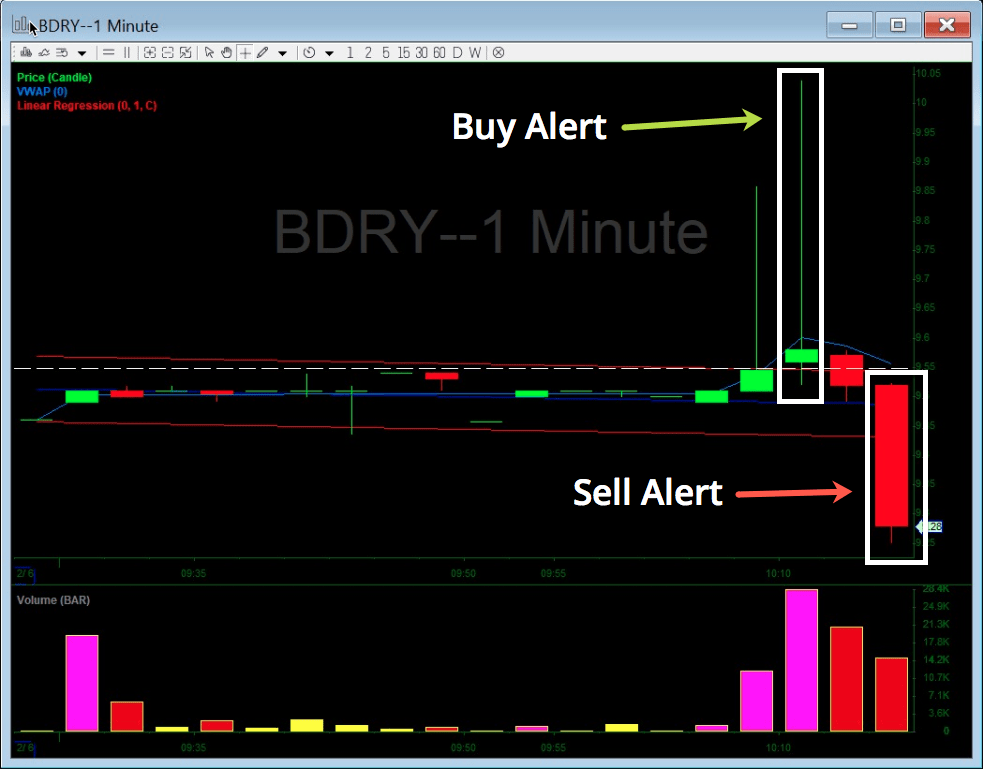
Chat pump
A stock is being promoted by a chat room or newsletter, leading to an artificial increase in volume. We want to be conscious of this because the chat room “sell alert” could lead to a similar artificial pullback.
Examples:
LBCC chat pump – be cautious
AQMS crowded chat pump
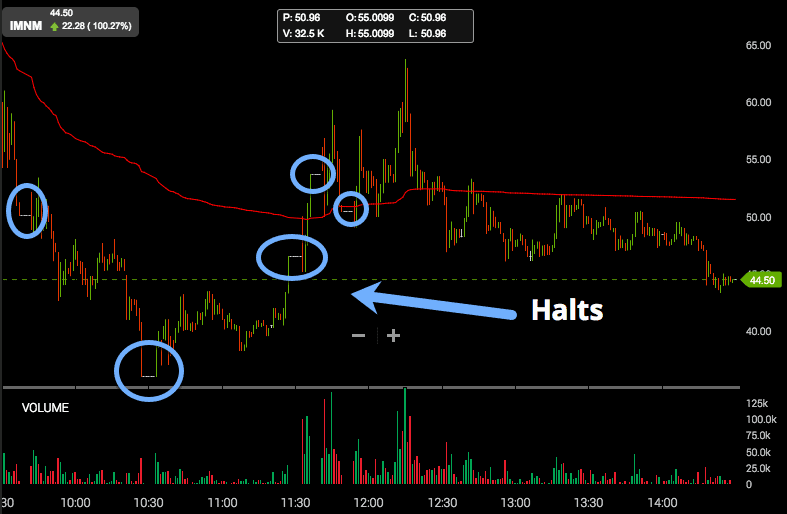
Circuits (Halt)
Circuit halts are triggered when stocks experience exceptional volatility in a short period of time. During these halts, all trading activity is “halted.” You cannot buy or sell shares until trading resumes. It can be helpful for traders to recognize when a stock is susceptible to a halt (and at what price levels) so they can avoid getting stuck in a position of uncertainty. For more details on circuit halts, check out the official documentation on the Nasdaq website.
Examples:
Circuit at $15.40 SCKT
PPIH Swipes to circuit
GTEC halted
Close/Closer
A stock is moving closer to an area of interest. For example, a stock may be close to breaking out or breaking down.
Examples:
RAD closer
VWAP test close SPY
Core position
A core position is the position you build in anticipation of a bigger move. You may take advantage of smaller intraday price movement while still holding onto a core position. For example, if a stock dips to $9 in the morning, you may buy shares, expecting the stock to run to $11 by the end of the day. In the meantime, you may take smaller positions in the middle of the day to lock in gains.
Examples:
NVDA trading around core
Locking some FB around core
Adding WMT to core
Crowded
A stock may be considered “crowded” when there are a bunch of traders trading the same idea. For example, if everyone is short RIOT, this may make it easier for the stock to squeeze. Similarly, if a stock is a crowded long, it may lead to a breakdown as traders cut losses.
Examples:
XNET crowded short
Avoiding SNAP crowded long
EOD
EOD stands for “end-of-day” and refers to how a stock will behave towards market close. The last hour of trading is generally more volatile than mid-day.
Examples:
WMT looking for EOD ramp
All done MDXG – will revisit EOD
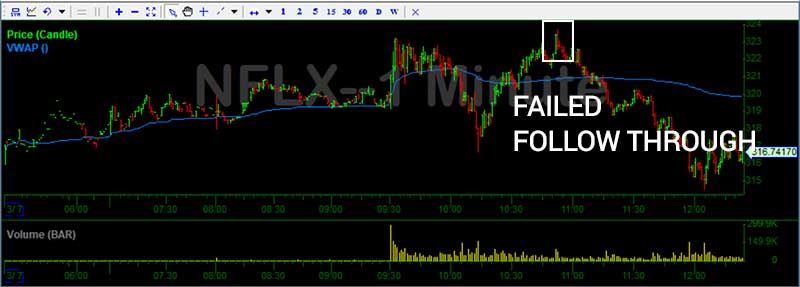
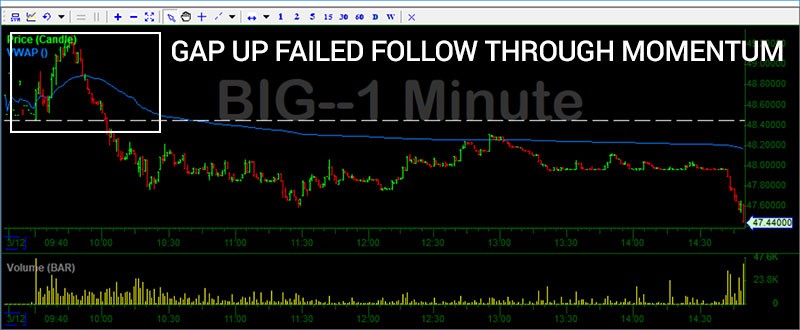
Failed Follow Through
Failed follow through occurs when a stock tries to break out and gets rejected. This can often lead to a trend reversal or pullback. This may be a good time to exit a long position or initiate a short position.
Examples:
AMAT failed follow through
Adding SQ short on failed follow through
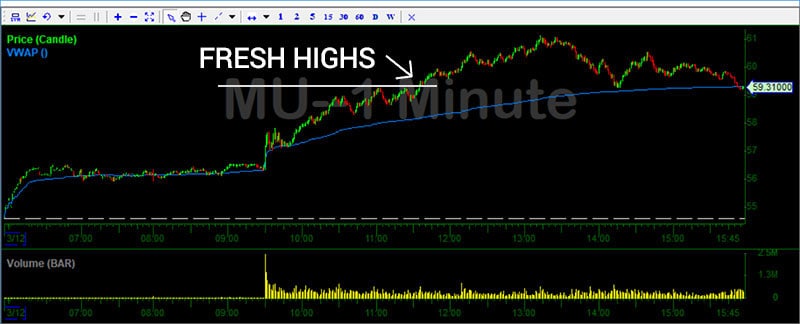
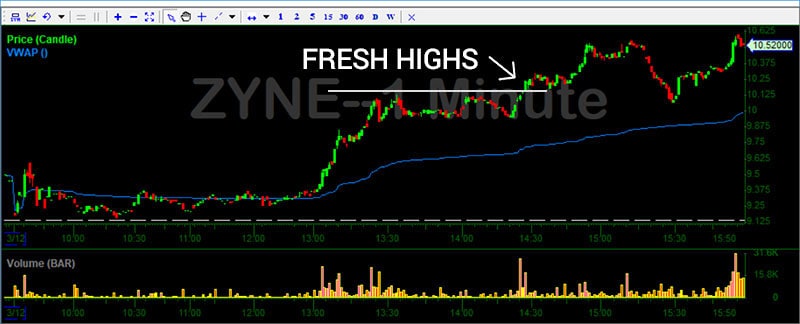
Fresh highs/lows
When stock has been running consolidating for a bit and makes a move towards new highs or lows. The goal is to draw attention to a stock that was previously struggling at highs/lows and now breaking above/below (meaning it’s back on radar).
Examples:
HTGM fresh highs
OSTK fresh lows
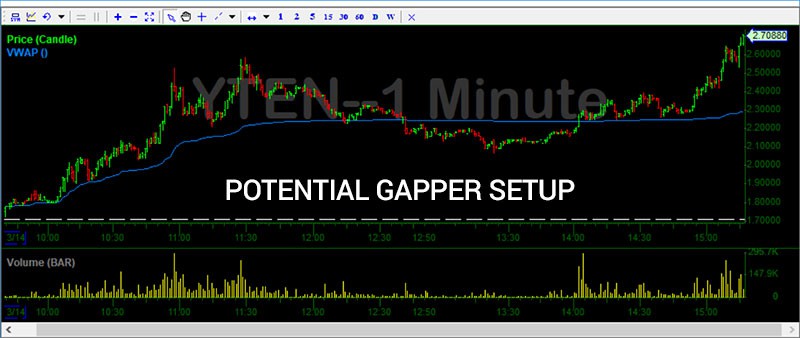
Gapper
A stock is generally considered a “gapper” if you plan to hold it into the next day. When a stock is running during the day, and closes on its highs – one might look to gap it to take advantage of possible follow thru the following morning
Examples:
SNAP is a gapper for me
Took some HTGM gapper
Guide
Guides are the price levels you use to navigate a trade. These are generally key price areas for a particular stock. For example, a stock is trading above VWAP, you may use VWAP as your guide for risk on a long trade.
Examples:
Using 13.80 as a guide on FOSL
Buying dips on MBI – $8 guide
Adding SQ short w/ VWAP guide
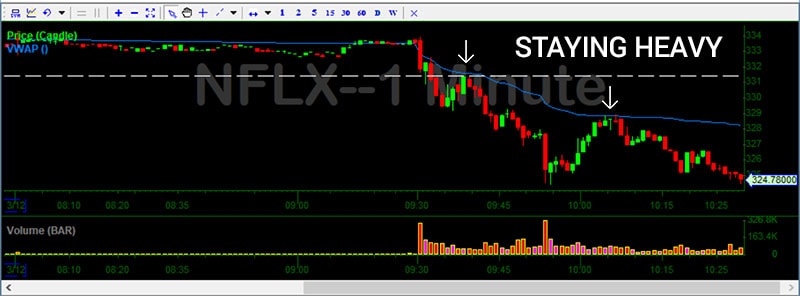
Heavy
A “heavy” stock struggles to gain upward momentum, making it a potential candidate for a short trade. The stock may be setting lower highs or experiencing failed follow through.
Examples:
SPY heavy
Locked DBVT but will re add if it stays heavy
HOD/LOD
“High of day” and “low of day” – referring to the high and low prices for the day.
Examples:
Short VRX – risking to HOD
Scooping some OMER risk to LOD
Holding trend
Holding trend (or “holding”) refers to a stock that is in an uptrend or downtrend. The stock may experience pullbacks or spikes, but is still following a specific trend for the day.
Examples:
GNC holding trend
NUGT holding trend – will wait for VWAP fail for short
Halt
When a stock halts, trading is temporarily paused and you cannot buy or sell shares. Halts can last for a few minutes or for days. There is inherent risk to holding a position into a halt because you do not know how the stock will react when trading reopens.
Examples:
APRI into halt
INPX about to halt
Higher Better
Allowing a stock to move higher while anticipating the short play. The higher the stock goes, the better the short opportunity will be.
Examples:
RIOT higher better but looking for failed follow through
CATM higher better. Look for the fade off later in the day
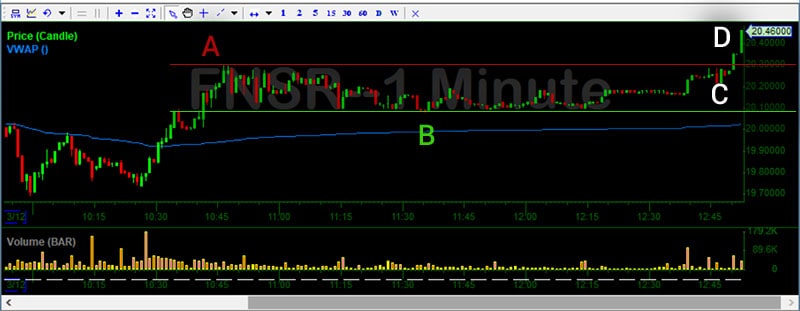
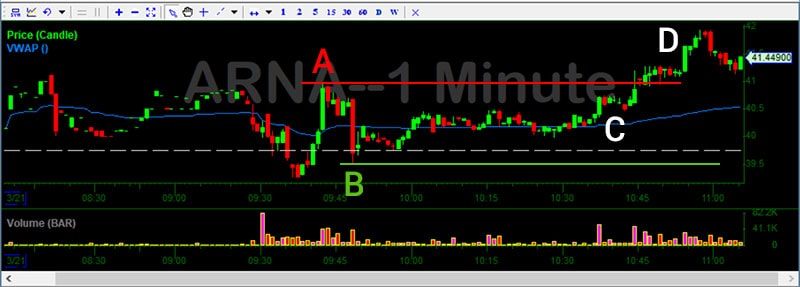
Key Areas
Key areas and levels are price points of interest. These are generally support/resistance levels that can be used for risk. For example, if a stock is trying to break above $20 all day, $20 would be a key area. A break above $20 would confirm a breakout and a rejection off $20 may represent failed follow through momentum.
Examples:
Key level on ANTH is $2.55
Watch the key levels on TRIP
Leaving Room
Giving a trade some space to work while anticipating risk and sizing accordingly (generally while scaling in with an early entry). For example, if you are long a stock at $5.50, you may choose a position size that allows the stock to move to $5 without taking on an uncomfortable amount of risk. You are “leaving room” for $5, meaning you won’t get stopped out. Think of this as “wiggle room” to make a trade work.
Examples:
Adding VRX short – leaving room to .90s
Took starter VXX – leaving room to $45
Locking In
Closing out part (or all) of a position. You can lock in gains, meaning you are turning profits from unrealized to realized.
Examples:
Locking in 1/3 GRPN
Nice ramp ZN – Lock in gains along the way!
Magnet
A psychological price level that a stock is drawn to (generally whole and half dollar marks). For example, a stock trading at $4.7 may have a $5 magnet, meaning it is drawn to that price (which may later act as resistance).
Examples:
$200 magnet on NFLX
WMT $92 magnet
Moving on Air
When a stock experiences high volatility on low volume. For example, if a stock runs from $10 to $12 on low volume, it could be considered to be “moving on air.” The key here is volume.
Examples:
OSTK moving on air
LFIN floating on air
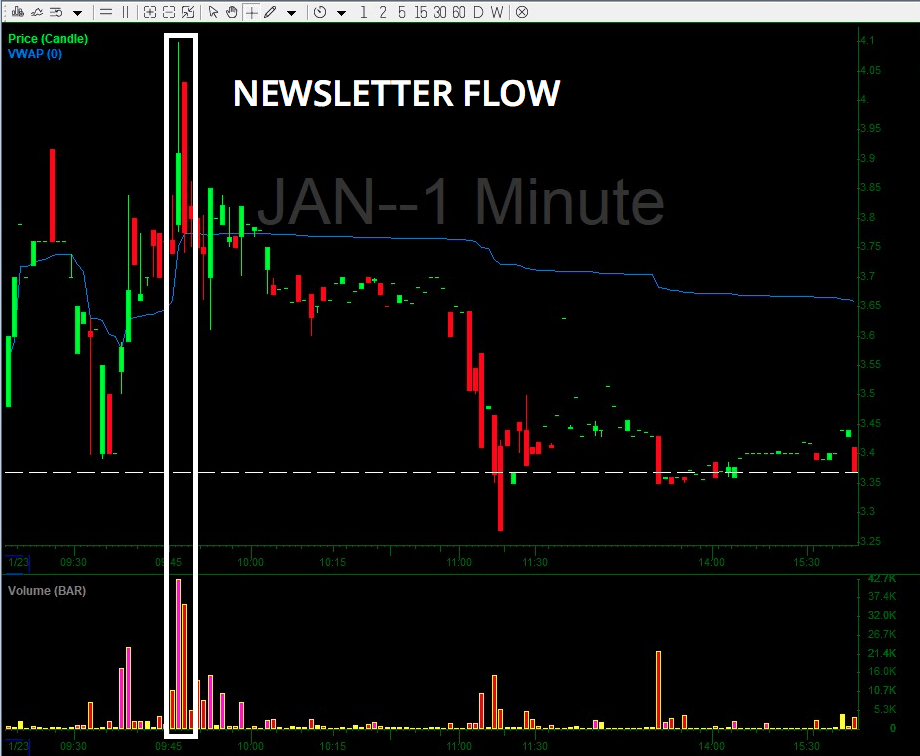
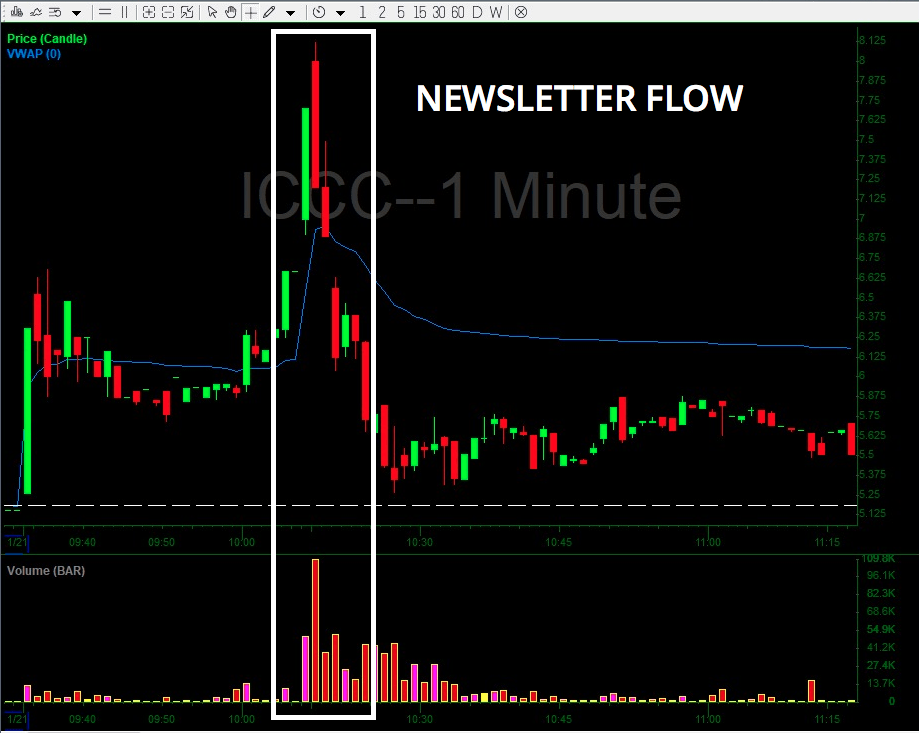
Newsletter
A “newsletter” is a third party that we’ve identified influences the market with their buy and sell alerts. This may be a chat room, newsletter or alert service. These third parties bring in non-organic buying that may allude to a stock’s future trading behavior.
Whereas organic breakouts bring real buyers who are building positions based on technicals, fundamentals, or news catalysts, non-organic breakouts (i.e. newsletter buys) represent buyers who are building positions solely because they received an alert from a service of chat room. These buyers are patiently awaiting a sell alert from that service or chat room that issued the initial buy alert. This means that the mass buying that sent the stock price up will eventually be met by mass selling that could send the stock price right back down.
When a newsletter alerts to the masses (typically selling within 10 seconds to 2 minutes into the volume they’ve created) you can assume that ALL the volume you just saw come in on the offer is likely going to come back on the bid. Therefore, 90% of the time it’s good to be aware, stay clear and understand why a particular stock moved when it did. Typically less toxic newsletter alerts happen after 11AM and don’t share the same characteristics as earlier alerts.
We will alert these situations as “newsletter” alerts. Out of respect, we will not share the names of the specific services behind the alerts.
Examples:
just sold a boat load JAN into newsletter per rules
IGCC newsletter
Next Leg Up/Down
As a stock trends up or down, it may find periods of consolidation before making another move up/down. For example, a stock may drop from $15 to $12, consolidate at $12, and then keep moving down. This move would be considered the “next leg down.”
Examples:
VXX next leg
HTGM next leg up
Non-Stop Fade
A stock that is slowly trending down all day.
TEVA non-stop fade
AAPL non-stop fade from open
On radar
A stock is considered to be “on radar” if it is setting up for a trade but not yet ready. For example, if you are waiting for an ABCD formation to complete, the stock may be on radar. A stock may also be taken “off radar” if the setup breaks.
Examples:
CALA on radar for EOD move
TWTR on radar for HOD break
On/Off VWAP
Analyzing how a stock reacts to the VWAP technical indicator. For example, if a stock is pulling back it may test the VWAP price level, meaning it is on VWAP. If VWAP holds as support and the stock keeps moving up, it would be considered “off VWAP.”
Examples:
SPY on VWAP
Adding GRPN off VWAP. Using VWAP as guide
Over/Under
A price level (similar to a magnet) where a stock consolidates before choosing the next price direction. These may be levels where you choose to set your risk. For example, if a stock is at $50.50, you may set your risk to “over/under” $50 to see how the stock reacts in that price area.
Examples:
CNET risking to 6.80s over/under
Eyeing KODK – will see how it reacts over/under VWAP
Pay Along The Way
If a trade moves in your favor, you should take profits along the way. This is the same as “locking in” profits. The goal is to make sure you don’t get greedy and turn a winner into a loser.
Examples:
Nice move on UVXY – pay yourself along the way
TEVA perfect. make sure to pay yourself
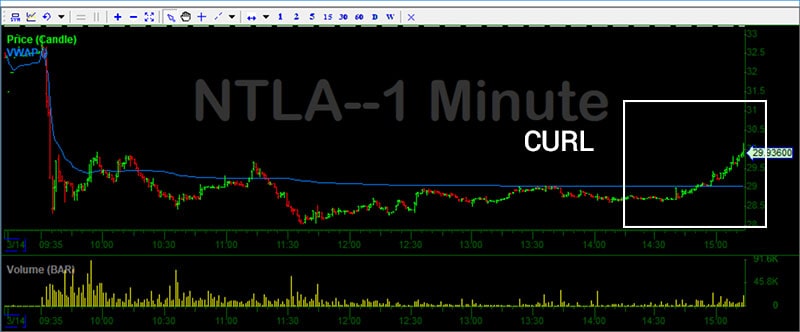
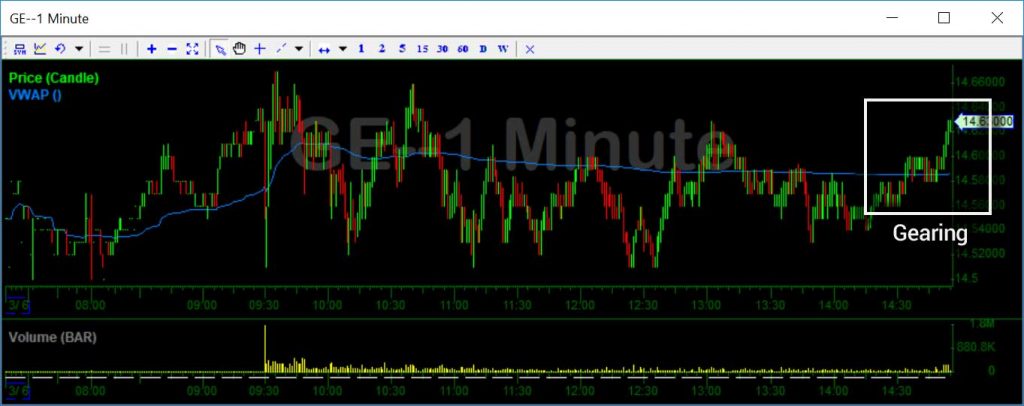
Perking/Gearing/Curling
Gearing, perking, and curling, refer to a stock’s price action when it starts to break above a channel or level of resistance. This may allude to a potential change in momentum.
Examples:
DPW perk
OREX perking
Pops
Short-term price spikes (generally referred to during a down trend). Whereas, you may buy on dips for a breakout, you may short on pops for a breakdown.
Examples:
Shorting all pops RAD
Leaning into pops MDXG
Push/Pull
A short term downward move (pull) or upward move (push). A push or pull may come before an increase in momentum.
Examples:
ROKU pull
HMNY .30 push
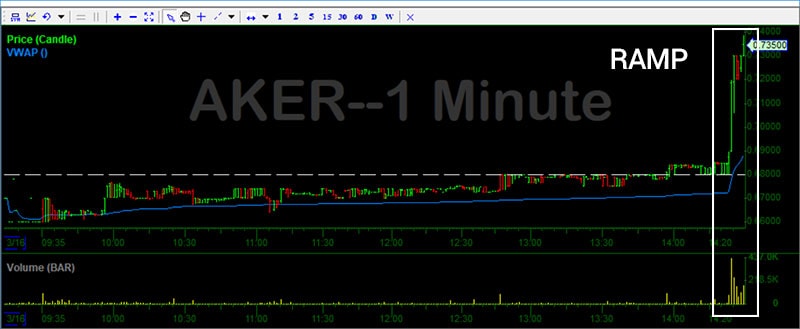
Ramp
A move upward that starts getting going, but isn’t big enough to label parabolic (identified by its “ramp” shape).
Examples:
SPY ramp
QCOM ramp
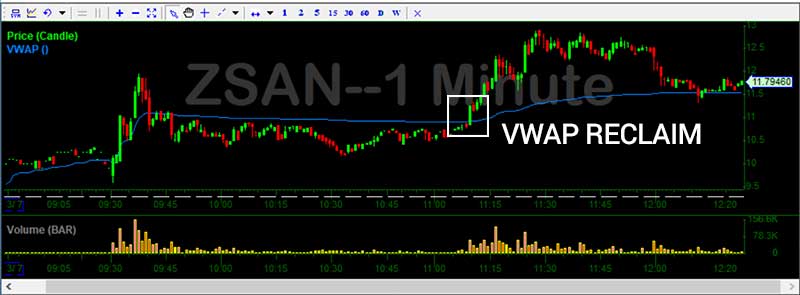
Reclaim
When a stock fails to hold a certain level and later breaks above it. For example, a stock may break below VWAP only to “reclaim” it later.
Examples:
SPY VWAP reclaim
Will wait for TWTR to reclaim VWAP before adding size
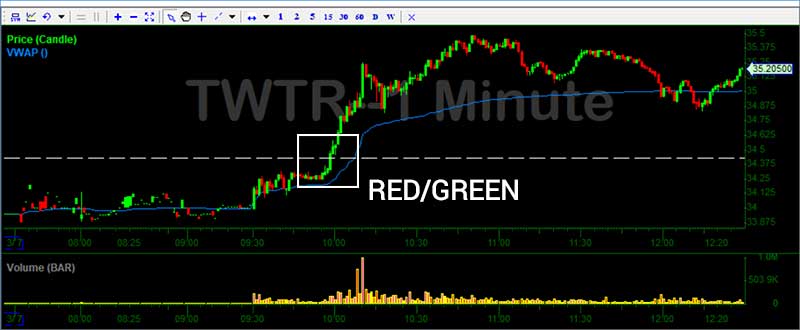
Red/Green (R/G)
When a stock moves from red (negative on the day) to green (positive on the day). This shift in sentiment is often followed by a boost of momentum.
Examples:
SPY testing r/g
AAPL r/g
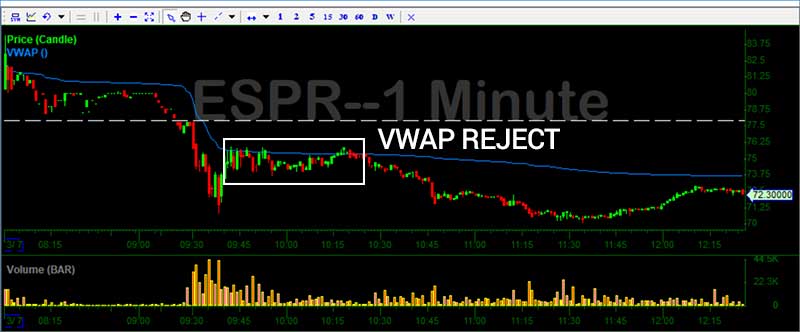
Reject
When a stock fails to break above a certain level, such as the high-of-day or VWAP.
Examples:
ESPR reject off VWAP
TWTR HOD reject
Revisit Later
Temporarily taking a trade off radar with plans to revisit it at a later point. For example, if you are expecting a breakout on SNAP but it keeps rejecting the high-of-day, you may take it off radar and revisit it after some consolidation.
Examples:
Done SNAP for now – will revisit tomorrow
Leaving HTZ alone for now – will revisit later
Risking To
Your stop loss area (mental or hard stop), based on key price levels. For example, if a stock has support at $7, you may risk to $7.
Example:
Adding HMNY long. Risking to VWAP
Short VRX. risking to HOD
TWTR trading nicely. Moving risk to entry
Scale/Scaling in
Building a position using multiple orders. This is a strategy for balancing risk and conviction. For example, if you wait for a stock to breakout, you have confirmation of the move (higher certainty) but will get a worse entry (higher risk). If you anticipate a break out, you will get a better entry (lower risk) but have less certainty. Scaling in allows you to balance the two approaches. You may add 1/2 your position in anticipation of a breakout and the other 1/2 after confirmation of the breakout.
Examples:
Scaling into VXX on dips.
Added 1/2 size NFLX
Covered 1/3 NUGT
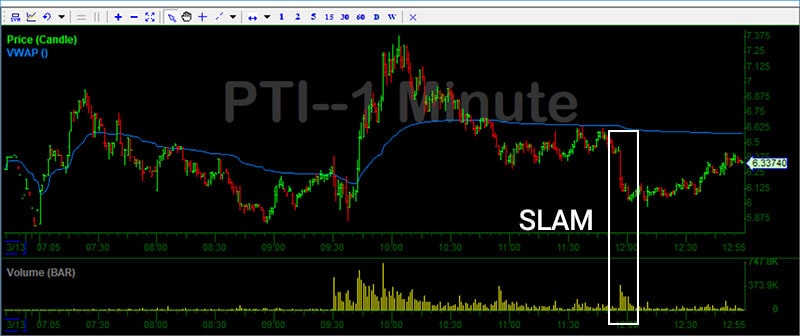
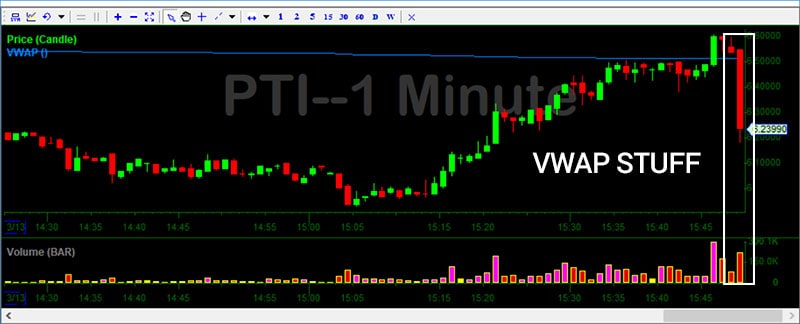
Slam/Stuff
A sudden downward move, often backed by higher volume. Think of this as someone “slamming” the bid with high order volume.
Examples:
OSTK nice slam
PTI slam
Starting (Long or Short)
The process of initiating a position with intent to scale in.
Examples:
Starting in SHOP
MARA starter. Waiting for confirmation
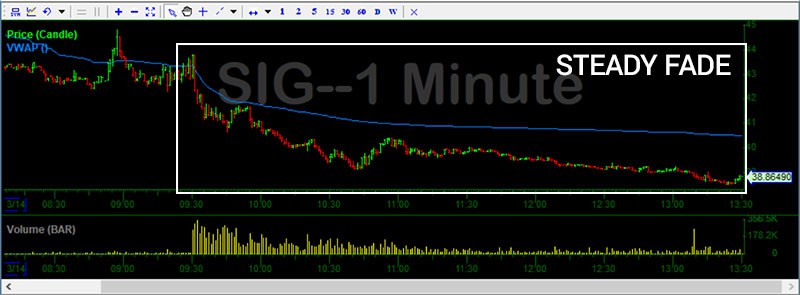
Steady Fade/Grind
A weak but consistent move upward (grind) or downward (fade). These are generally lower volume, lower volatility moves.
Examples:
CYH steady grind
MIC steady fade all day
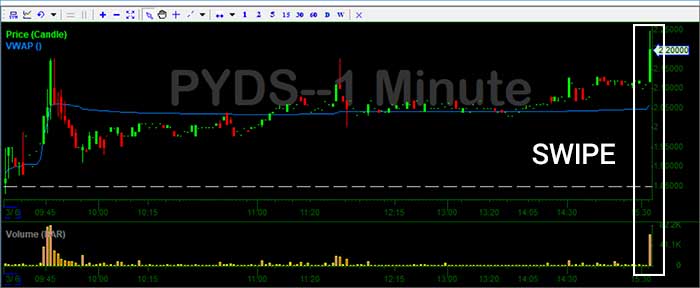
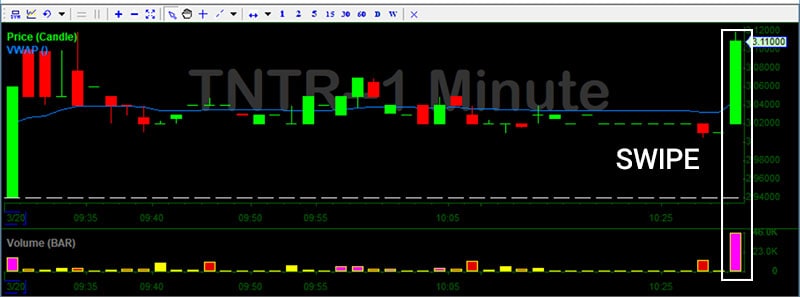
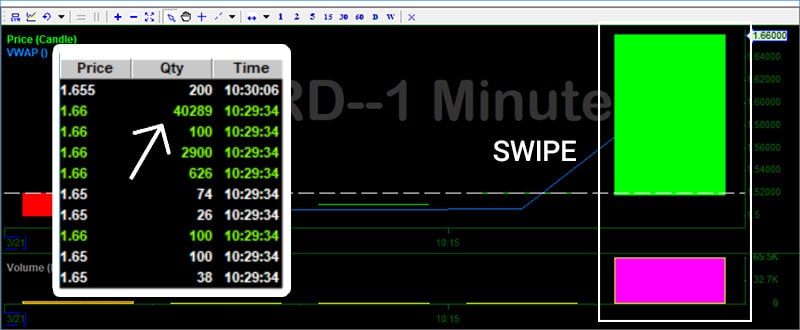
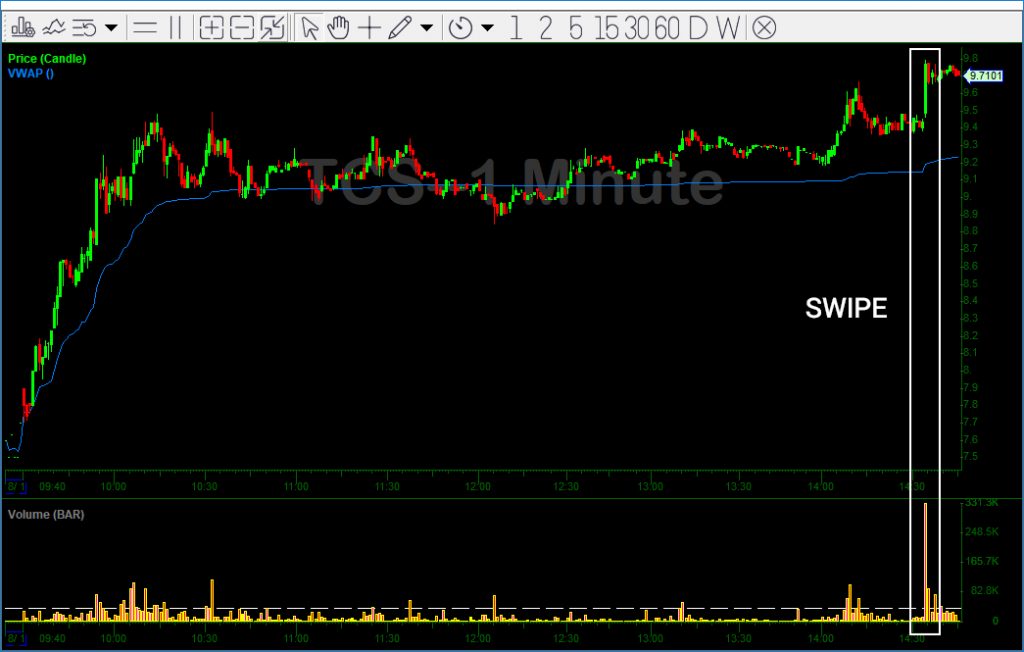
Swipe
A sudden upward move backed by volume. Think of this as someone “swiping” the offers on the ask.
Examples:
MYSZ .20 swipe
ECYT swipe
Thin/Low Float
A stock that with higher volatility due to a low float. A “float” is a stock’s supply, and stocks with lower floats can experience higher volatility on lower volume.
Examples:
KBIO thin. Could go to 20
RIOT low floater
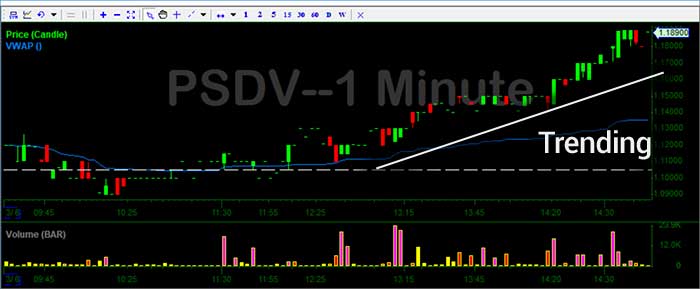
Trending
A stock moving in one direction (up or down) with low volatility.
Examples:
TWTR trending
CHK big trend today
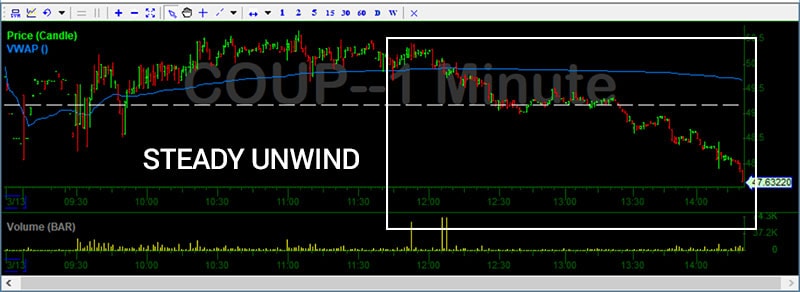
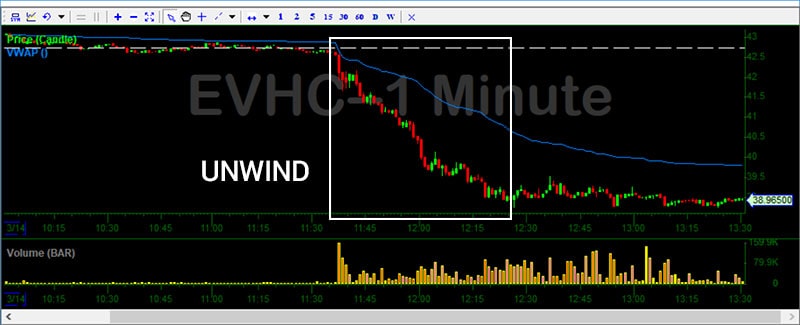
Unwinding
A stock that is downtrending with very few popups and no signs of reversal.
Examples:
MIC unwinding
OMER steady unwind – dont try to catch the bottom
Washout/Wash
The price action of a stock moving downward, generally experiencing above average volatility. Think of this as “washing out” the previous owners as stop losses are hit.
Examples:
Looking for a $77 washout on W
Adding shares of ROKU off the wash
Leaning
Slowly sizing into a short position.
Examples:
Leaning into SLCA small size
Looking to lean into pops on TRIP if this continues to fade
Squeezing
A stock that is moving upward due to shorts covering their positions.
Examples:
XNET squeezing shorts right now
OSTK squeezing early shorts
Everyone is short VRX right now – may start squeezing above VWAP
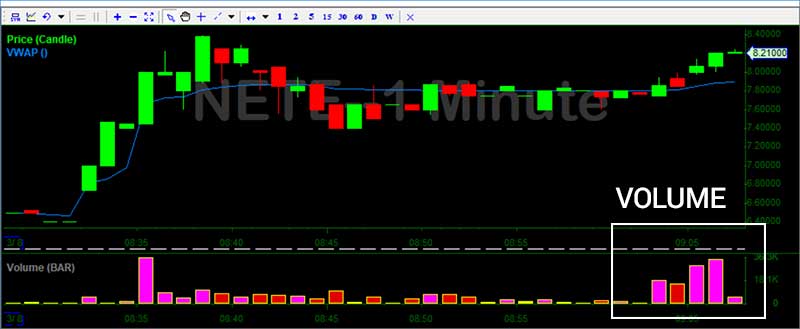
Volume
An alert related to higher relative intraday volume.
Examples:
ACRX volume
Volume building NETE