Day Trading Encyclopedia
Stock Charts Price and Volume

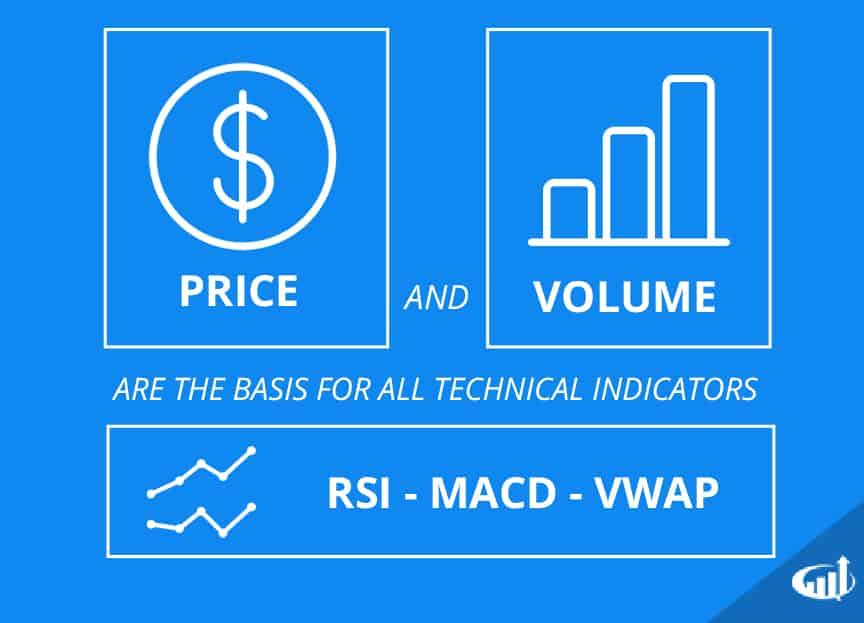
As complicated as many technical indicators may seem, they are all rooted in the same two data sources: price and volume.
Price and Volume
The price of an executed trade and the volume of that trade are the two independent pieces of market participant data collected to develop charts and various indicators and study tools. Time is another variable central to indicators but is not an input derived from market participants. Some of the more common indicator tools like moving averages, pivot points, stochastic, RSI, MACD, Bollinger bands and VWAP all utilize a combination of price, volume and time inputs in a way to generate the particular output or signal. Traders develop their own interpretation based on the indicator signals. There are literally hundreds of indicators and studies all spawned from just price and volume data.
