
Day Trading Encyclopedia
Chart Patterns Triangles
Ascending Triangle Chart Pattern
Triangle Patterns
Triangles are known as continuation patterns, meaning the trend stalls out to gather steam before the next breakout or breakdown. They are named triangles as the upper and lower trend line eventually meet to form a tip and connecting the starting points of both trend lines completes a triangle shape. The support trend line continues to close the channel until the resistance price level breaks on heavy volume to resume the prior trend again. There are three types of triangle patterns.
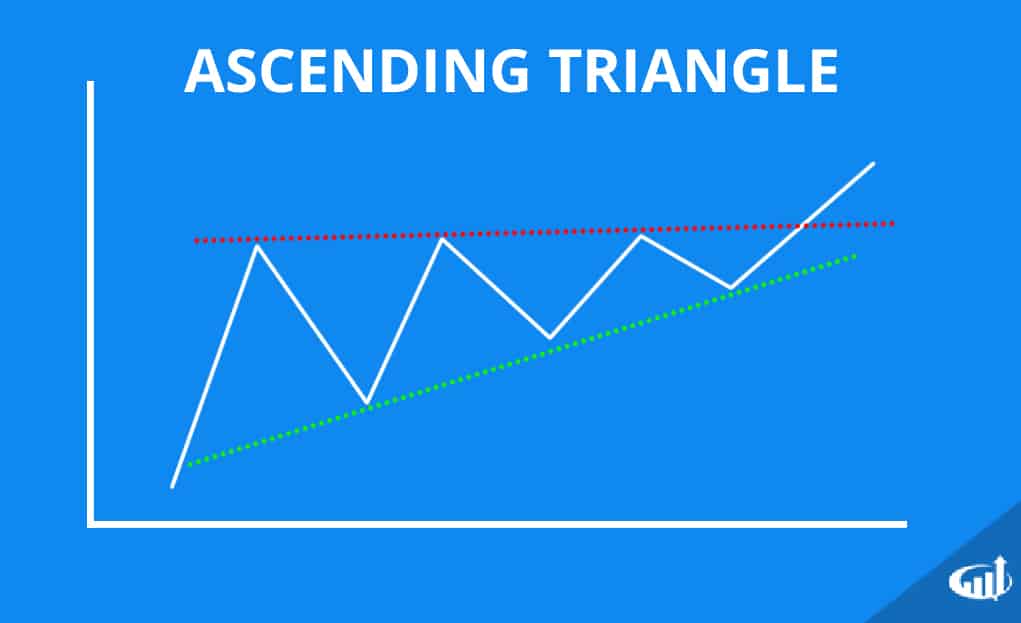
Ascending Triangles
Ascending triangles are bullish continuation patterns that form when the upper trend line is flat or horizontal while the lower trend line continues to rise diagonally. This indicates the up trend has stalled while the support line representing buyers continues to rise, thereby closing the distance between the lower and upper trend line. Eventually the lower trend line closes in the gap enough to cause impatient bidders to come off the fence in a buying spree that surges the price through the upper trend line resistance with heavy volume. This breakout action resumes the next leg on the up trend as prices climb to new highs.
Descending Triangles
Descending triangles are bearish continuation patterns. They are an inverted version of ascending triangles. The form as a downtrend stalls out. The lower support trend line goes flat or horizontal as the upper trend line continues to fall diagonally closing the gap. The upper trend line represents sellers anxious to unload their position by lowering the ask/offer prices. Eventually sellers get impatient and overwhelm the support trend line by dumping shares. This triggers panic as the price collapses in a breakdown that kick starts the next leg of the downtrend making new lows.
Symmetrical Triangle Chart Pattern
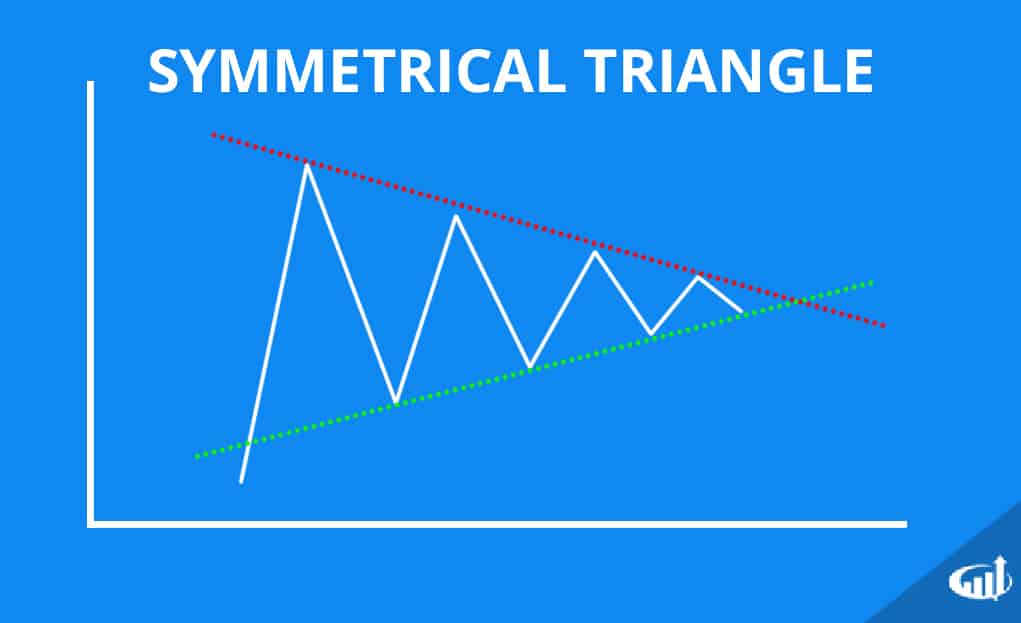
Symmetrical Triangles
Symmetrical triangles are continuation patterns of the prior trend, which may be bullish or bearish. These are indicated with a falling upper trend line and a rising lower trend line. This indicates both the sellers lowering their offers, while buyers are raising their bids. Eventually, one of the trend lines will break to trigger the next leg in the preceding trend. These triangles usually will have three contact points before they trigger the break. This means the lower, upper and lower or upper, lower and upper trend lines tag prior to the break that resumes the earlier trend. The longer the triangle goes without a break as the price gets closer to the pinnacle, the greater the chances of a failure.
Triangle Failures
When the triangles fail to break the resistance trend line and actually break through the support trend line, it is considered a failed triangle pattern. Failed patterns can result in strong trend reversals. Traders should be prudent with stop-losses when a triangle pattern fails. Seasoned traders will look to reverse their positions or enter the trend reversal when this occurs to capitalize on the potential panic reaction from the trapped participants that expected the triangle to form.