
Day Trading Encyclopedia
Chart Patterns Bull and Bear Flags
Bull Flag Patterns
Flag Patterns
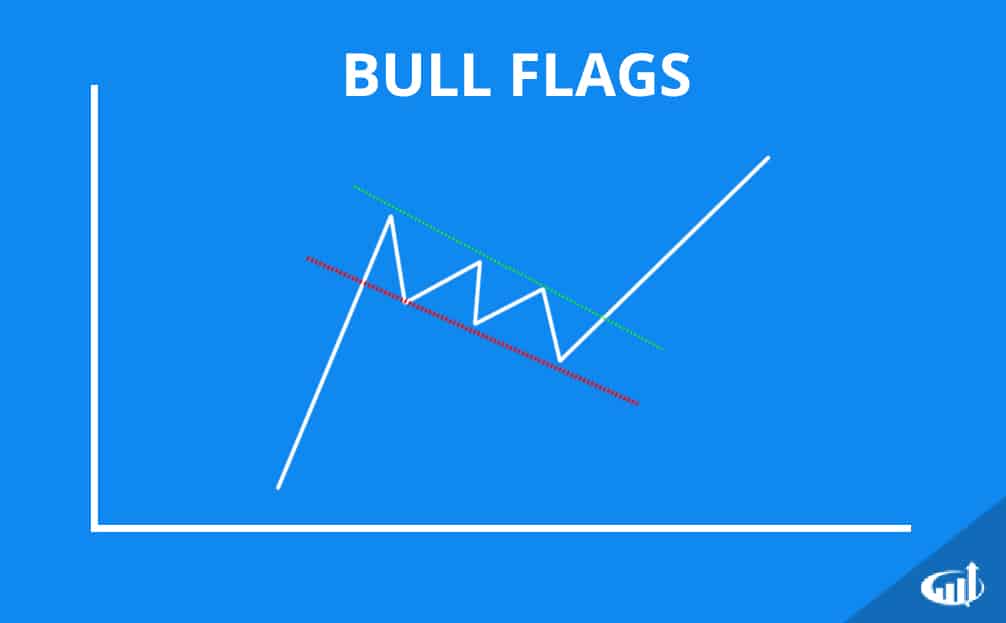
Flags are continuation patterns of the preceding trend leading up to the flag. They form after a parabolic price rise or fall and then form a short-term reversion trend with parallel rising or falling upper and lower trend lines. The flagpole illustrates the preceding trend, and the flag is the reversion just before the breakout or breakdown that continues the prior trend.
Bullish Flag
Bull flags form after a price spike that peaks out and slowly forms a short-term reversion downtrend. The starting points for the trend lines should connect the highest highs (upper trend line) and the highest lows (lower trend line) to represent the flag portion. While the lines are sloping down, they should remain relatively parallel to each other. Eventually the price should spike up through the upper trend line triggering shorts to cover and buyers to come off the fence. When the price exceeds the highest high, the bull flag is formed as buyers rush in making new highs and the next leg of the up trend resumes.
Bear Flag Patterns
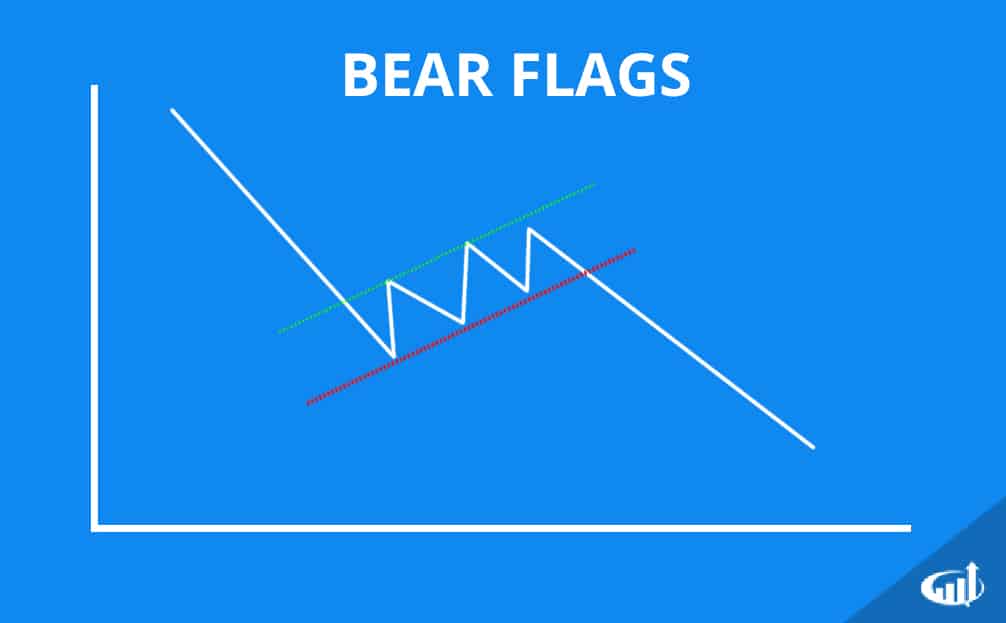
Bearish Flags
Bear flags form after a large price collapse that attempts a short-term up trend reversion. These are the opposite of bull flags. The trend lines connect the lows and highs starting from the bottom. The trend lines should maintain a parallel distance between each other until the price collapsed back under the lower trend line. This triggers longs to unload their positions as panic sets in when the price falls through the lowest low. This triggers the bear flag breakdown and subsequent resumption of the next leg of the prior downtrend as prices make new lows.